For a brief overview of some of the new features in this release, see the Core 2.6 Orientation Video.
New Features
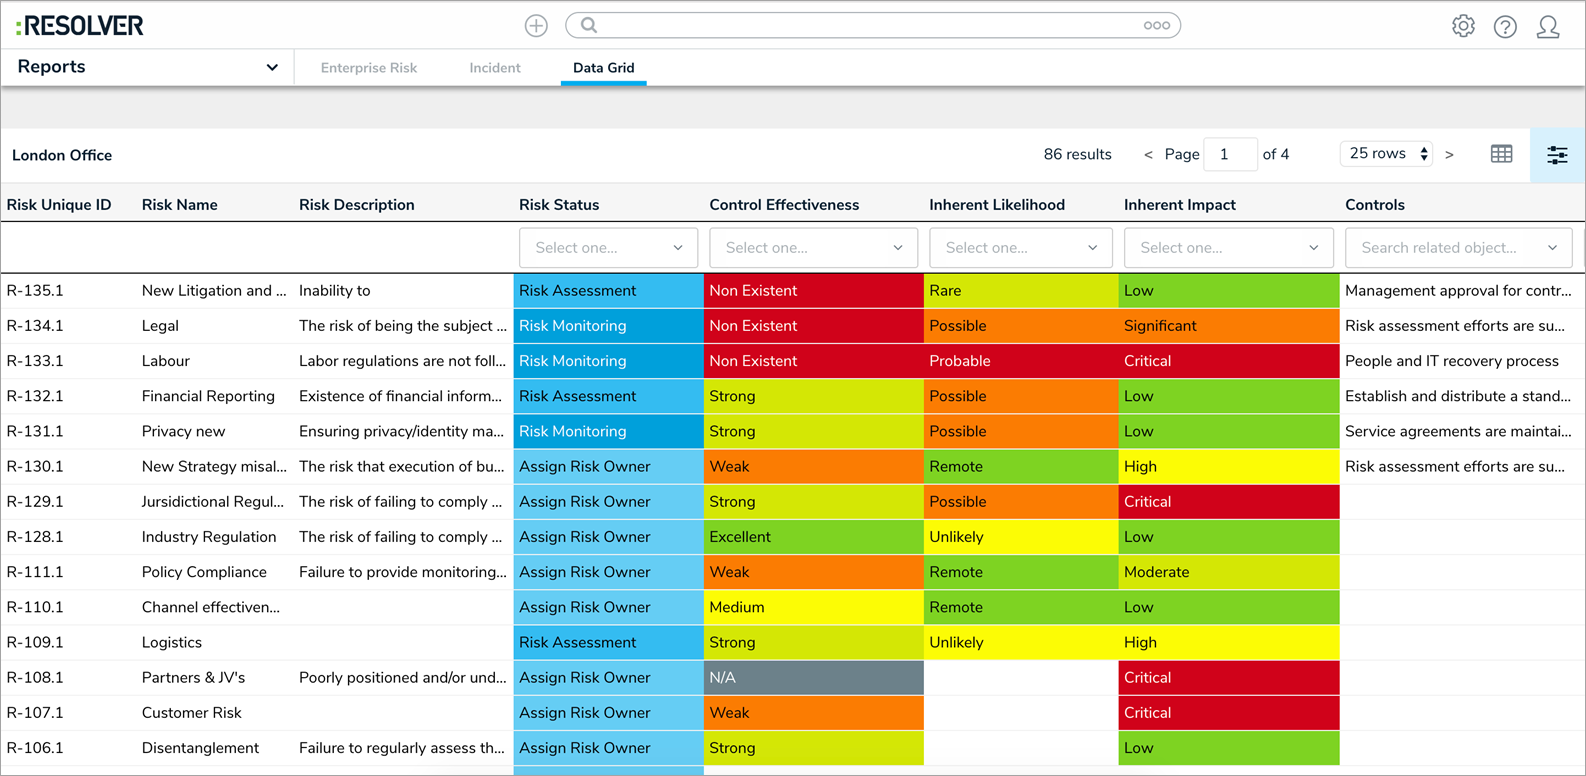
Data Grid
- The new data grid displays object data selected by an admin in a spreadsheet-style format. End users can edit the fields, sort, filter, and search for data, show or hide columns, click through pages, and adjust column width and the number of rows displayed per page. Admins can also select if some or all of the fields in the grid are read-only or editable.

Pull Data Values Workflow Action
- The new Pull Data Values workflow actions copies field and relationship data from related objects into another object once it transitions into the next state.
Menu Toggles
- The Quick Add, Search, and Help menu items in the top bar can now be toggled on or off for a role, granting administrators more control over which tools and features a user can access.
Repeatable Forms Parameters
- Administrators can now apply parameters to a repeatable form element to control which data is displayed.
Relative Date Parameters
- Admins can select relative date parameters on tables, data grids, and repeatable forms to show data within more generic time period. Options now include:
- Today
- Last 30 days
- Last 90 days
- Last 180 days
- Custom
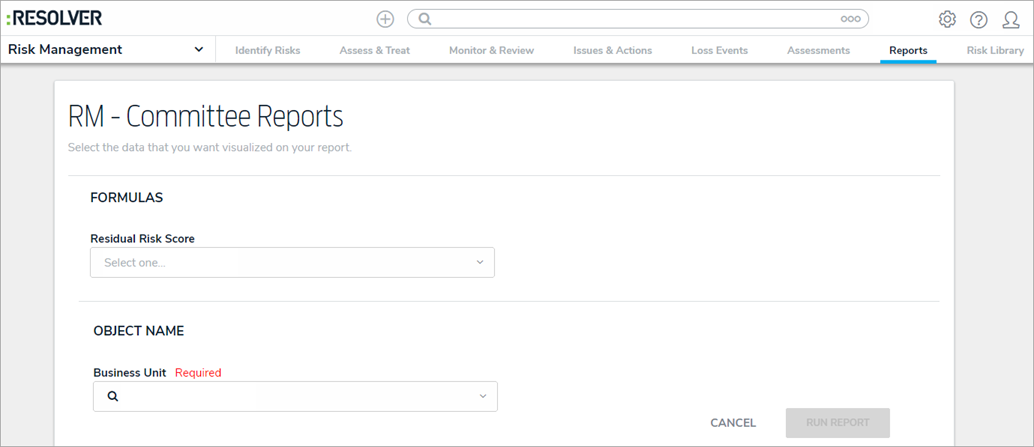
Required Filters
- If a report-level filter is marked as required by an administrator, users must now apply a value to that filter before the report is loaded.

Create Object Action Notifications
- A notification banner appears when objects are successfully created through a Create Object action on a workflow transition. The ellipsis (...) in the banner displays a list of the objects created. Clicking one of those objects in the list will display the new object.
Relationship Table Sorting
- Objects in relationship tables on standard forms are now automatically sorted by their Unique IDs (newest to oldest).
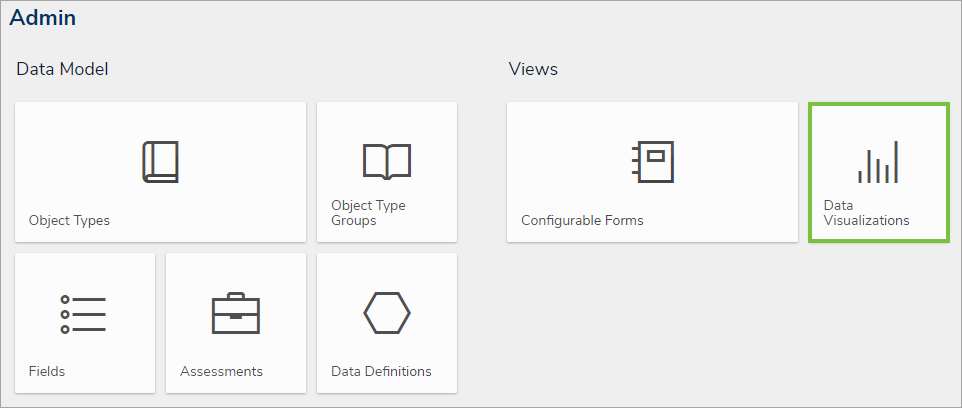
Data Visualizations
- The Reports settings in Admin has been renamed to Data Visualizations. Functionality in these settings remain the same and you can still create and edit reports (charts, tables, heat maps, and repeatable forms) and data analytics reports, along with the new data grids.

Bug Fixes
- Corrected an issue that prevented select lists from being searchable in report filters.
- Assessment dimensions are now separated by commas when displayed on forms.
- Images are no longer stretched when displayed in a palette in Chrome.
- Fixed a issue that resulted in users seeing a blank screen when switching between multiple starred reports.
- Date filters are no longer duplicated on the report filter palette.
- Nightly triggers will no longer send duplicate emails to users.
- Clicking Refresh on a report page with repeatable forms will now display a new data set when an object is edited.
- Opening a report with repeatable forms from a nav form tree will no longer display a blank page.
- Fixed the assessment labels and adjusted the placement of the Add and Remove buttons on the scoping page.
- Assessment workflows can now be selected as report parameters.
- The Inferred Permissions tree is no longer blank after deleting an object type that was selected in the tree.
- Fixed a bug in tables that caused the forms selected in a role's workflow permissions to override custom form selections.
- A data analytics export will no longer timeout when exporting a large data set.