Overview
Administrators can add tables to reports within Resolver. Tables display data in text form that can also be exported to Microsoft Word or Excel.
User Account Requirements
The user account you use to log into Resolver must have Administrator permissions to access Data Visualizations.
Related Information/Setup
Please refer to the Add a View article for further information on exporting table data from a View.
Please refer to the Views Over article for more information regarding Views.
Please refer to the Workflow Permissions article for more information on role permissions.
Please refer to the Add Parameters to a Report article for more information on report parameters.
Please refer to the Properties on Forms article for more information on table properties.
Please refer to the References on Object Types article for more information on references.
Please refer to the Views Overview and Create a Report View articles for more information on adding a report to a report view.
Navigation
- From the Home screen, click the Administration icon.

Administration Icon
- From the Administrator Settings menu, click Admin Overview.
Administrator Settings Menu
- From the Admin Overview screen, click the Data Visualizations tile under the Views section.


Data Visualizations Tile
- On the Data Visualizations screen, from the list of data visualizations, click the data visualization that you want to add a table to.
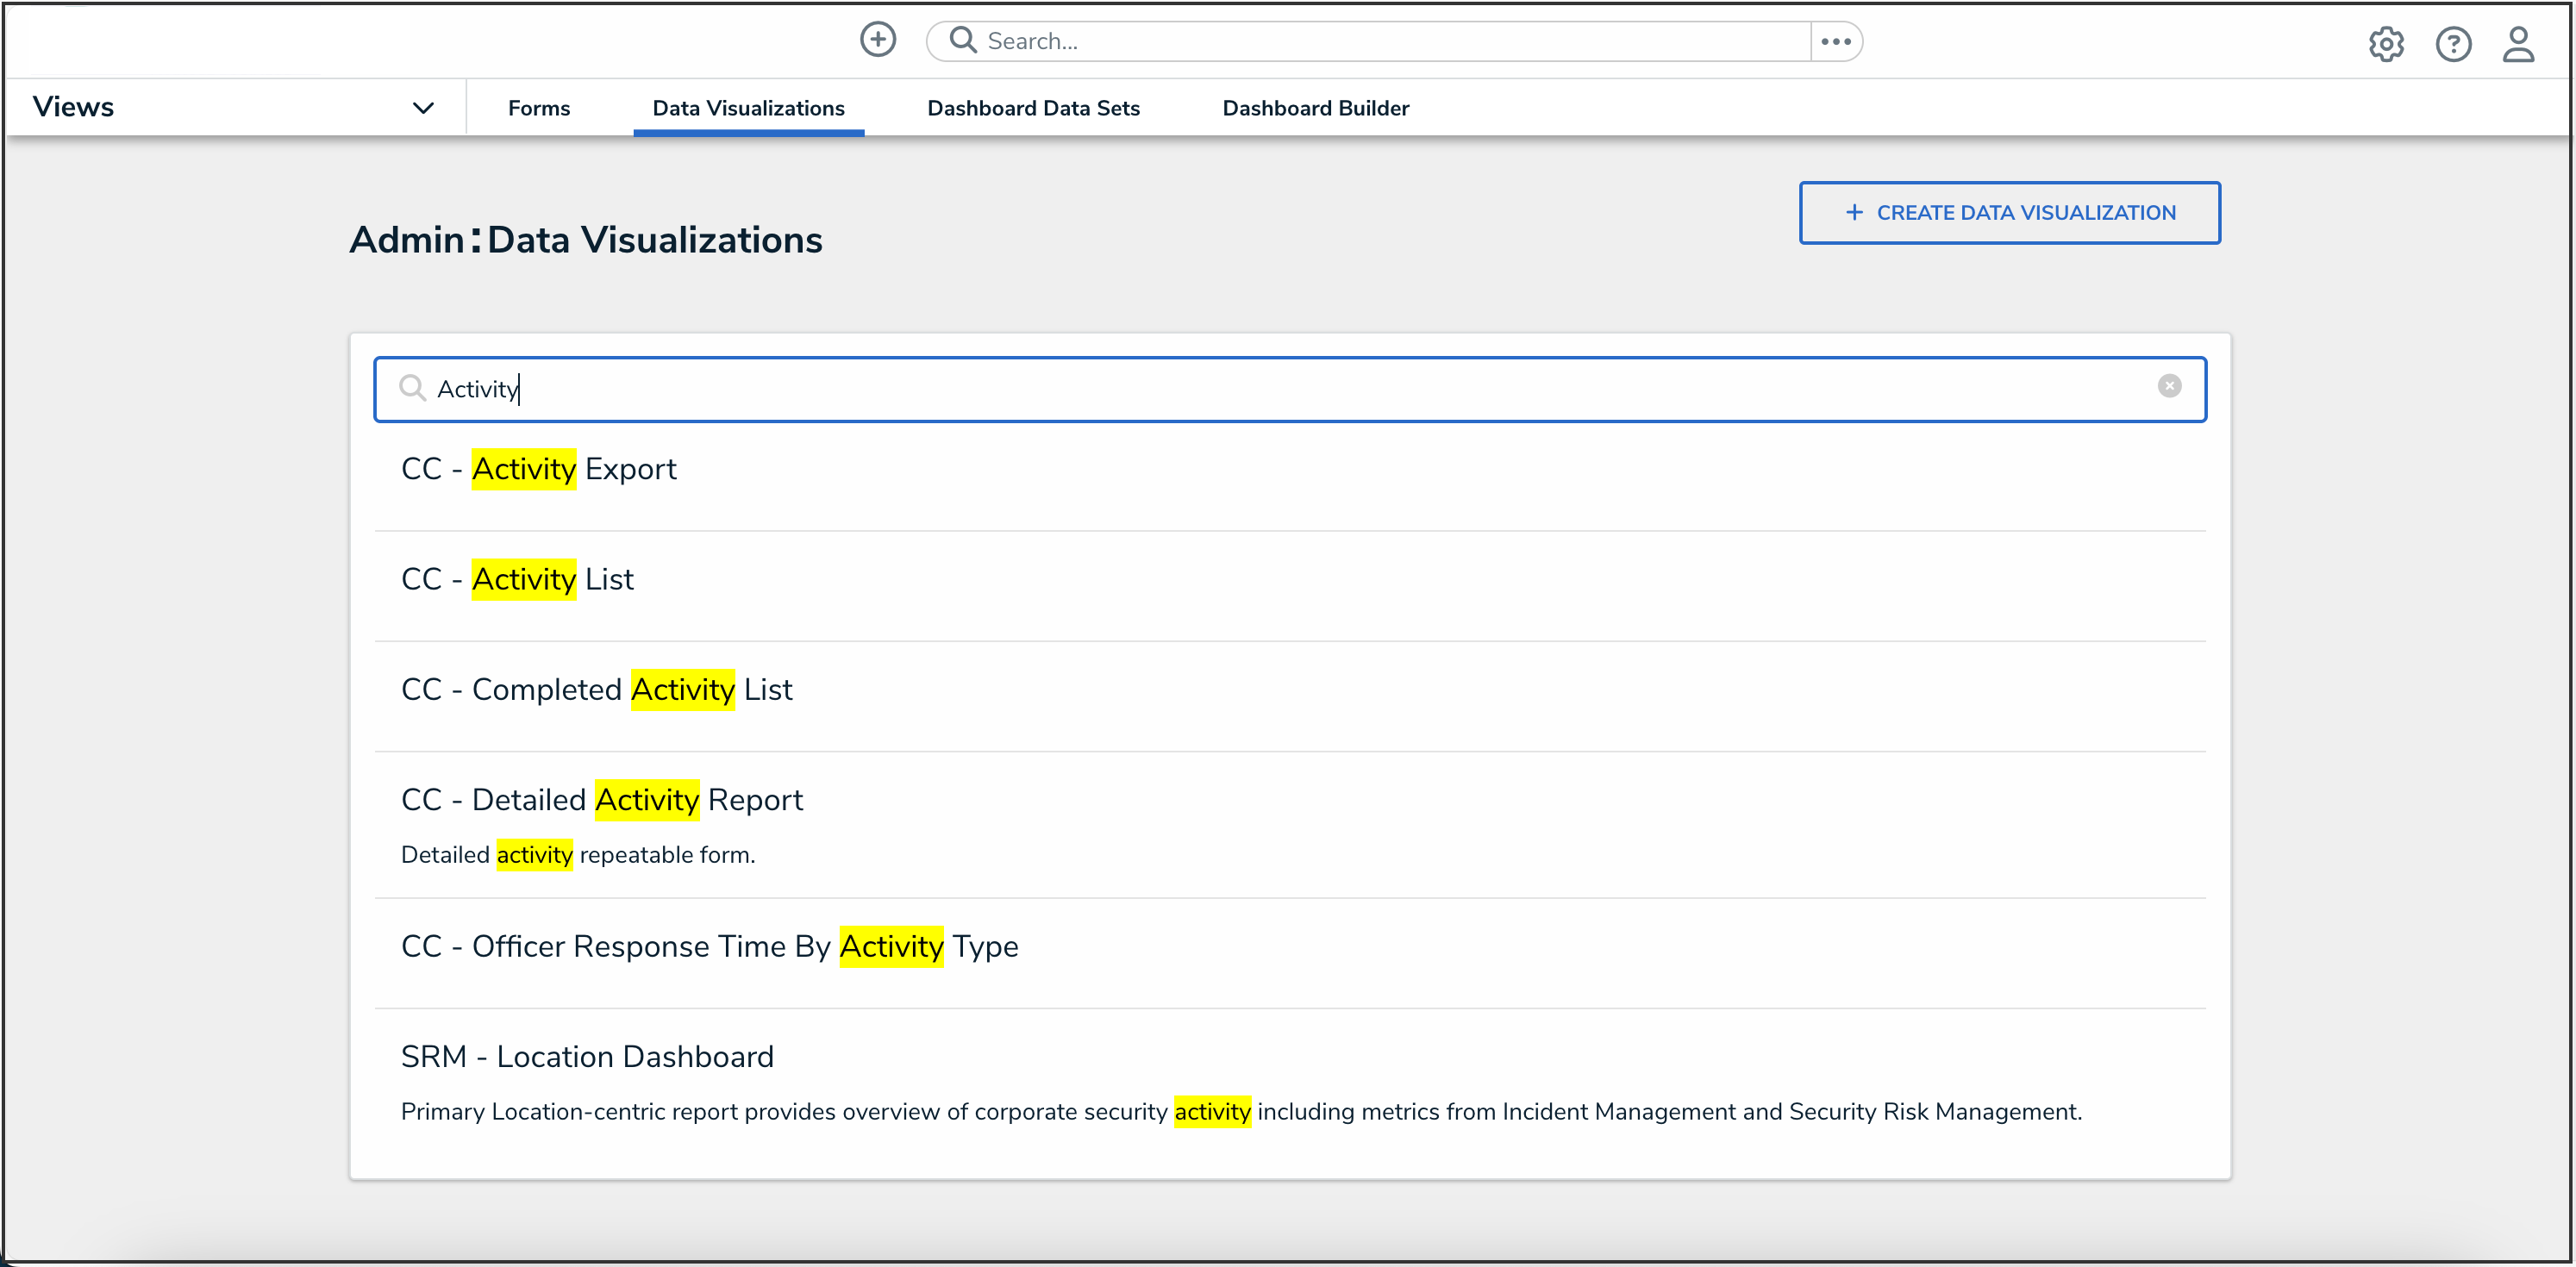
List of Data Visualizations

Adding a Table to a Report
- From the Edit Report screen, click the Expand icon next to Display under the Elements section.
![]()
Expand Icon
- (Optional): Click the Free Form Text tile and drag and drop it on the Report Canvas. The Free Form Text tile will allow you to create a table header.
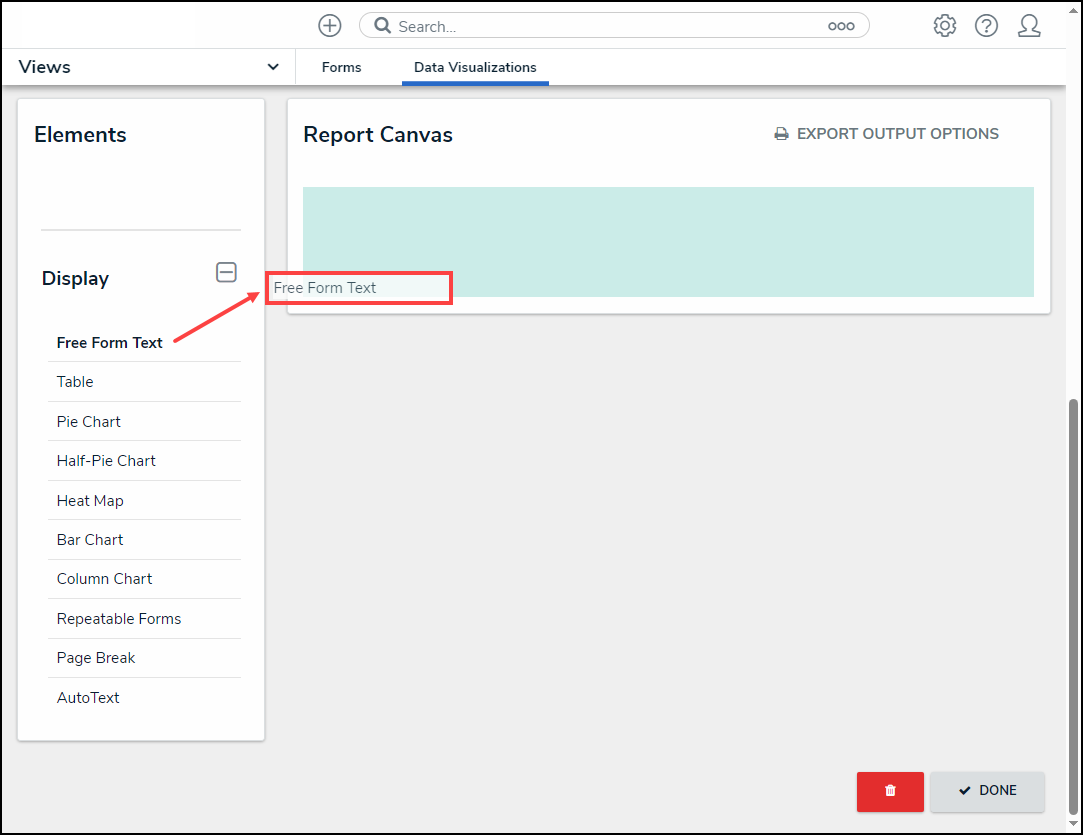
Drag and Drop Free Form Text Tile
 Note:
Note:
If you already have report elements on your Report Canvas, new report elements will appear at the bottom of the Report Canvas.
- Scroll to the bottom of the Report Canvas, hover over the Free Form Text element and select the Edit icon.
![]()
Edit Icon
- Enter a Table Name and Description in the Content field. You can use Markdown to add additional formatting to the text.
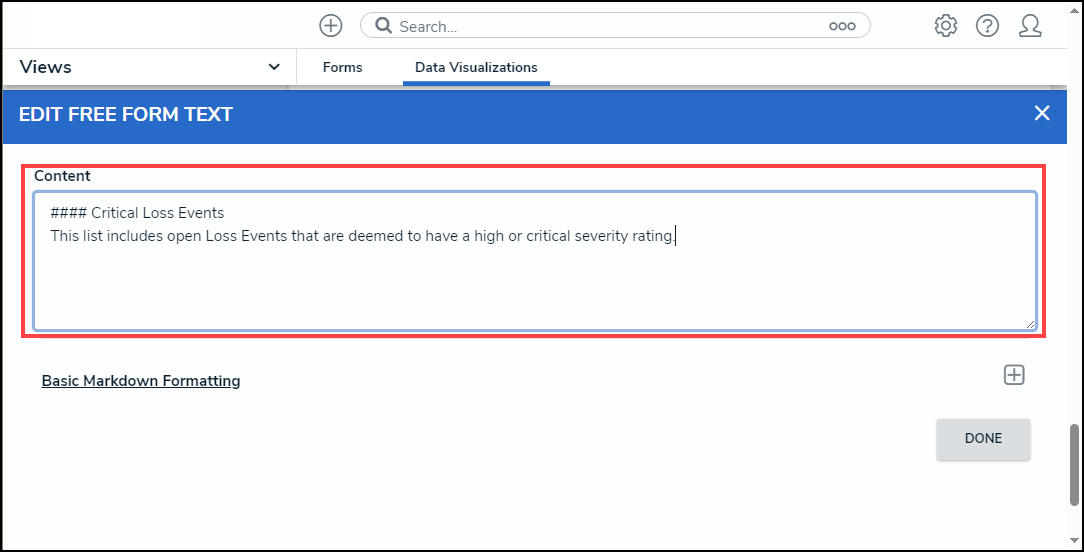
Content Field
- (Optional): Click the Expand icon for additional help with Markdown.
![]()
Expand Icon
- Click the Done button to apply your changes.
- From the Edit Report screen, drag and drop the Table tile onto the Report Canvas.
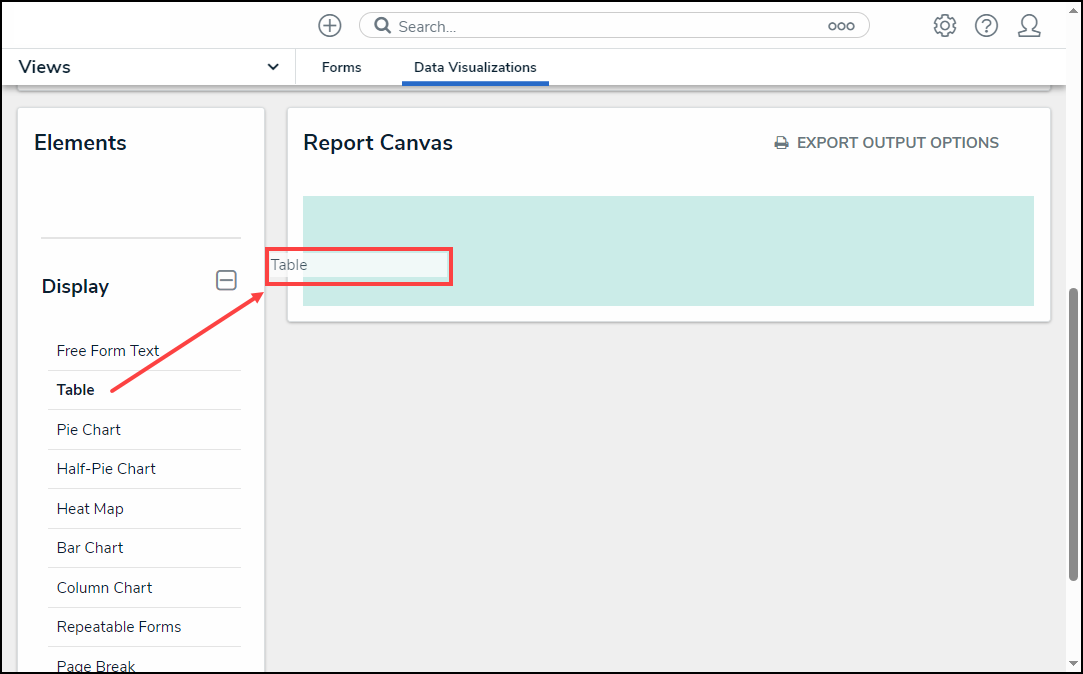
Drag and Drop Table Tile
- From the Add Table screen, select a data definition from the Select a data series dropdown menu. The data definition selected will determine the object types available to display in the table.
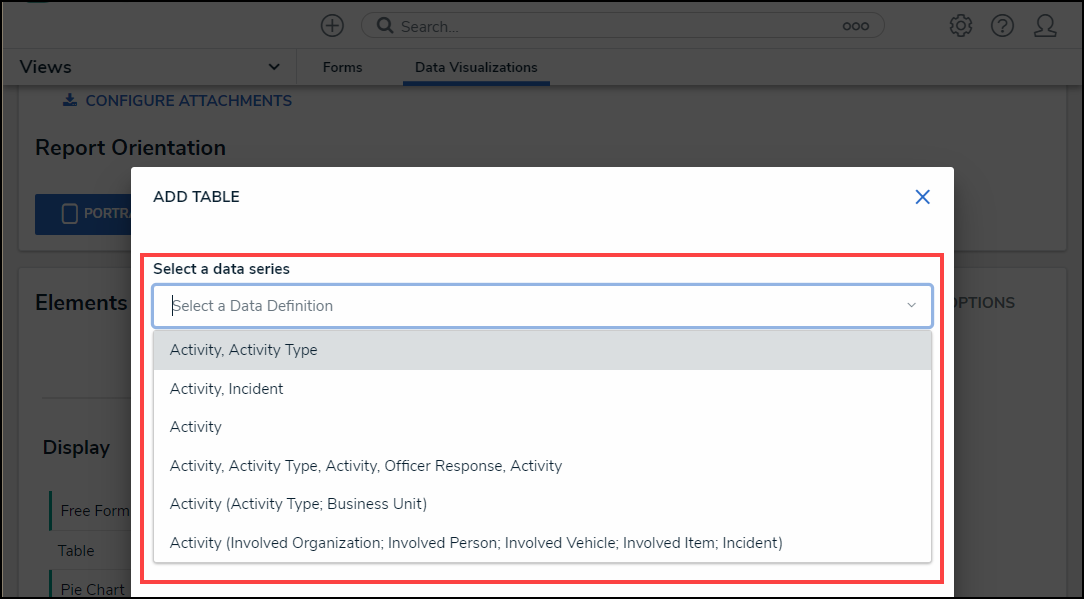
Select a Data Series Dropdown Menu
- Click the Done button.
- You will return to the Admin: Edit Table screen, and the Edit Table pop-up will appear.
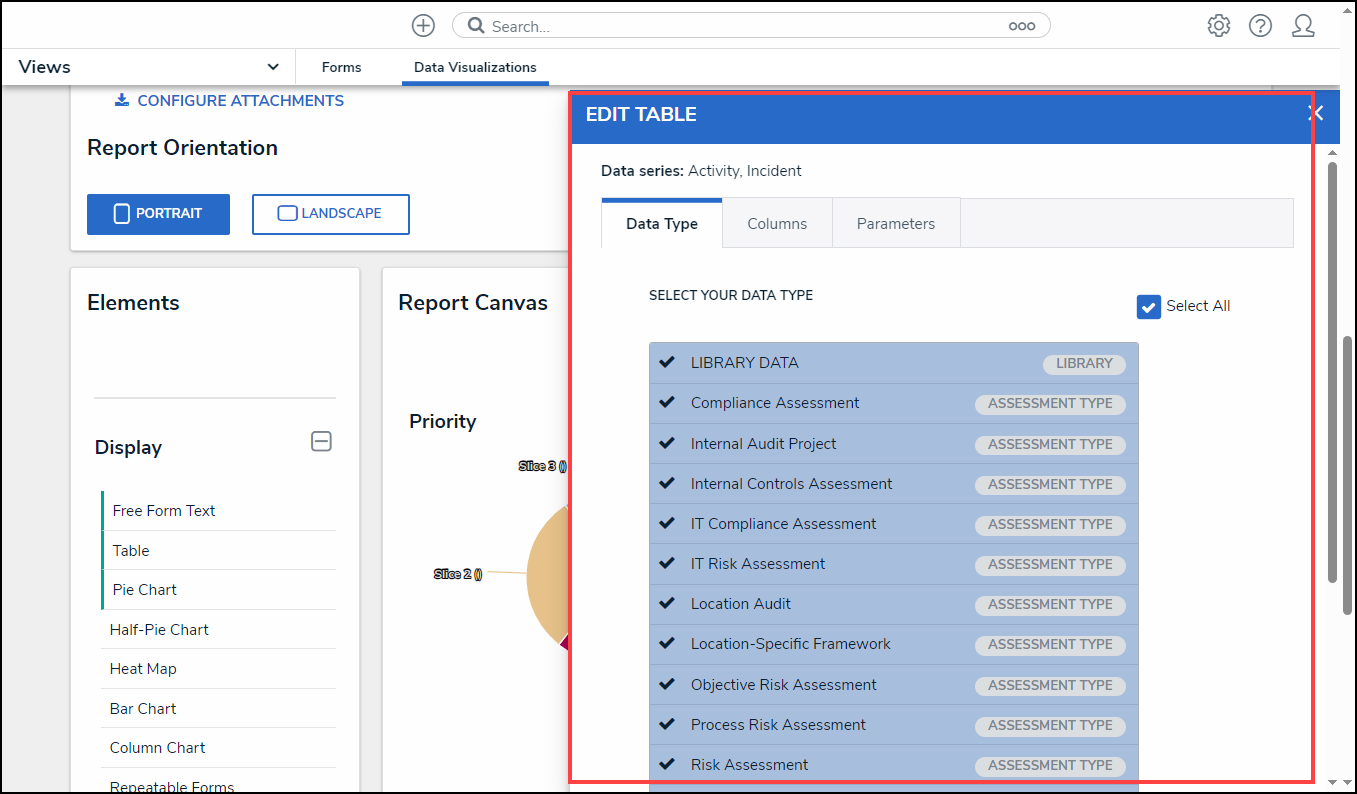
Edit Table Pop-up
- From the Data Type tab on the Edit Table pop-up, the Select All checkbox is enabled by default, automatically selecting all data types. Deselecting the Select All checkbox will allow you to choose select data types as opposed to all data types.

Select All Checkbox
- Select the data types to display by clicking on a data type and placing a checkmark next to the selected data type.

Select Data Types
- Selecting LIBRARY DATA will include object type data while selecting an Assessment Type will include the assessment name and workflow state.
- The following data can appear in a table:
- Properties: Object Type properties include Name, Unique ID, or Location (If an address is not available, coordinates are displayed. Map rendering is not supported). For more information, please refer to the Properties on Forms article.
- Fields: An Object's field value includes plan or rich text, numeric, date and time, select list, attachments, and formulas.
- Relationships: The Object's Relationship Name indicates that two or more objects are connected together through object types on an object type group added to a relationship on another object type.
- References: The Object's Reference Name indicates an object is connected to another object through a relationship. Unnamed references will be hidden from the tables to avoid confusion; however, if a reference name is removed from a table after being added as a table column. In that case, the relationship name will be displayed for the reference in the Edit Table configuration, and Unresolved Reference will be used as the table column header. For more information, please refer to the References on Object Types article.
- Workflow State: The Object's current Workflow State is the various stages of the data collection process (e.g., Create, Triage, Review, Investigate, Close).
- Roles: The users added to an object. User names must be added to a form on the Role field to appear within this column.
- Assessment Name/Workflow State: The name of the related assessment and its Workflow State.
- Click the Columns tab.

Columns Tab
- Select a relationship from the Select a Relationship dropdown menu. The relationship selected controls the data that appears on the Select Data dropdown menu.

Select a Relationship Dropdown Menu
-
(Optional): Enter a keyword in the Search field to narrow your search.

Select Data Search Field
-
Click on a property, workflow state, field, formula, relationship, reference, or role to add the information to the table using a data column.

Select a Column Element
- (Optional): Deselect a column element (field, workflow state, etc.) to remove the column from the table.
- Select a default form from the Default Custom Forms dropdown menu. The form selected will appear when a user clicks on the table data. Choosing Default will display the form on the user's role permissions for the object type.

Default Custom Forms Dropdown
- (Optional): From the Sort Columns section, click the Delete icon to remove a column from the table.
![]()
Delete Icon
- (Optional): Click the Move icon to rearrange the columns on the table.
![]()
Move Icon
- (Optional): From the Default Sort By drop-down menu, choose which column you want to have the table default sort by.
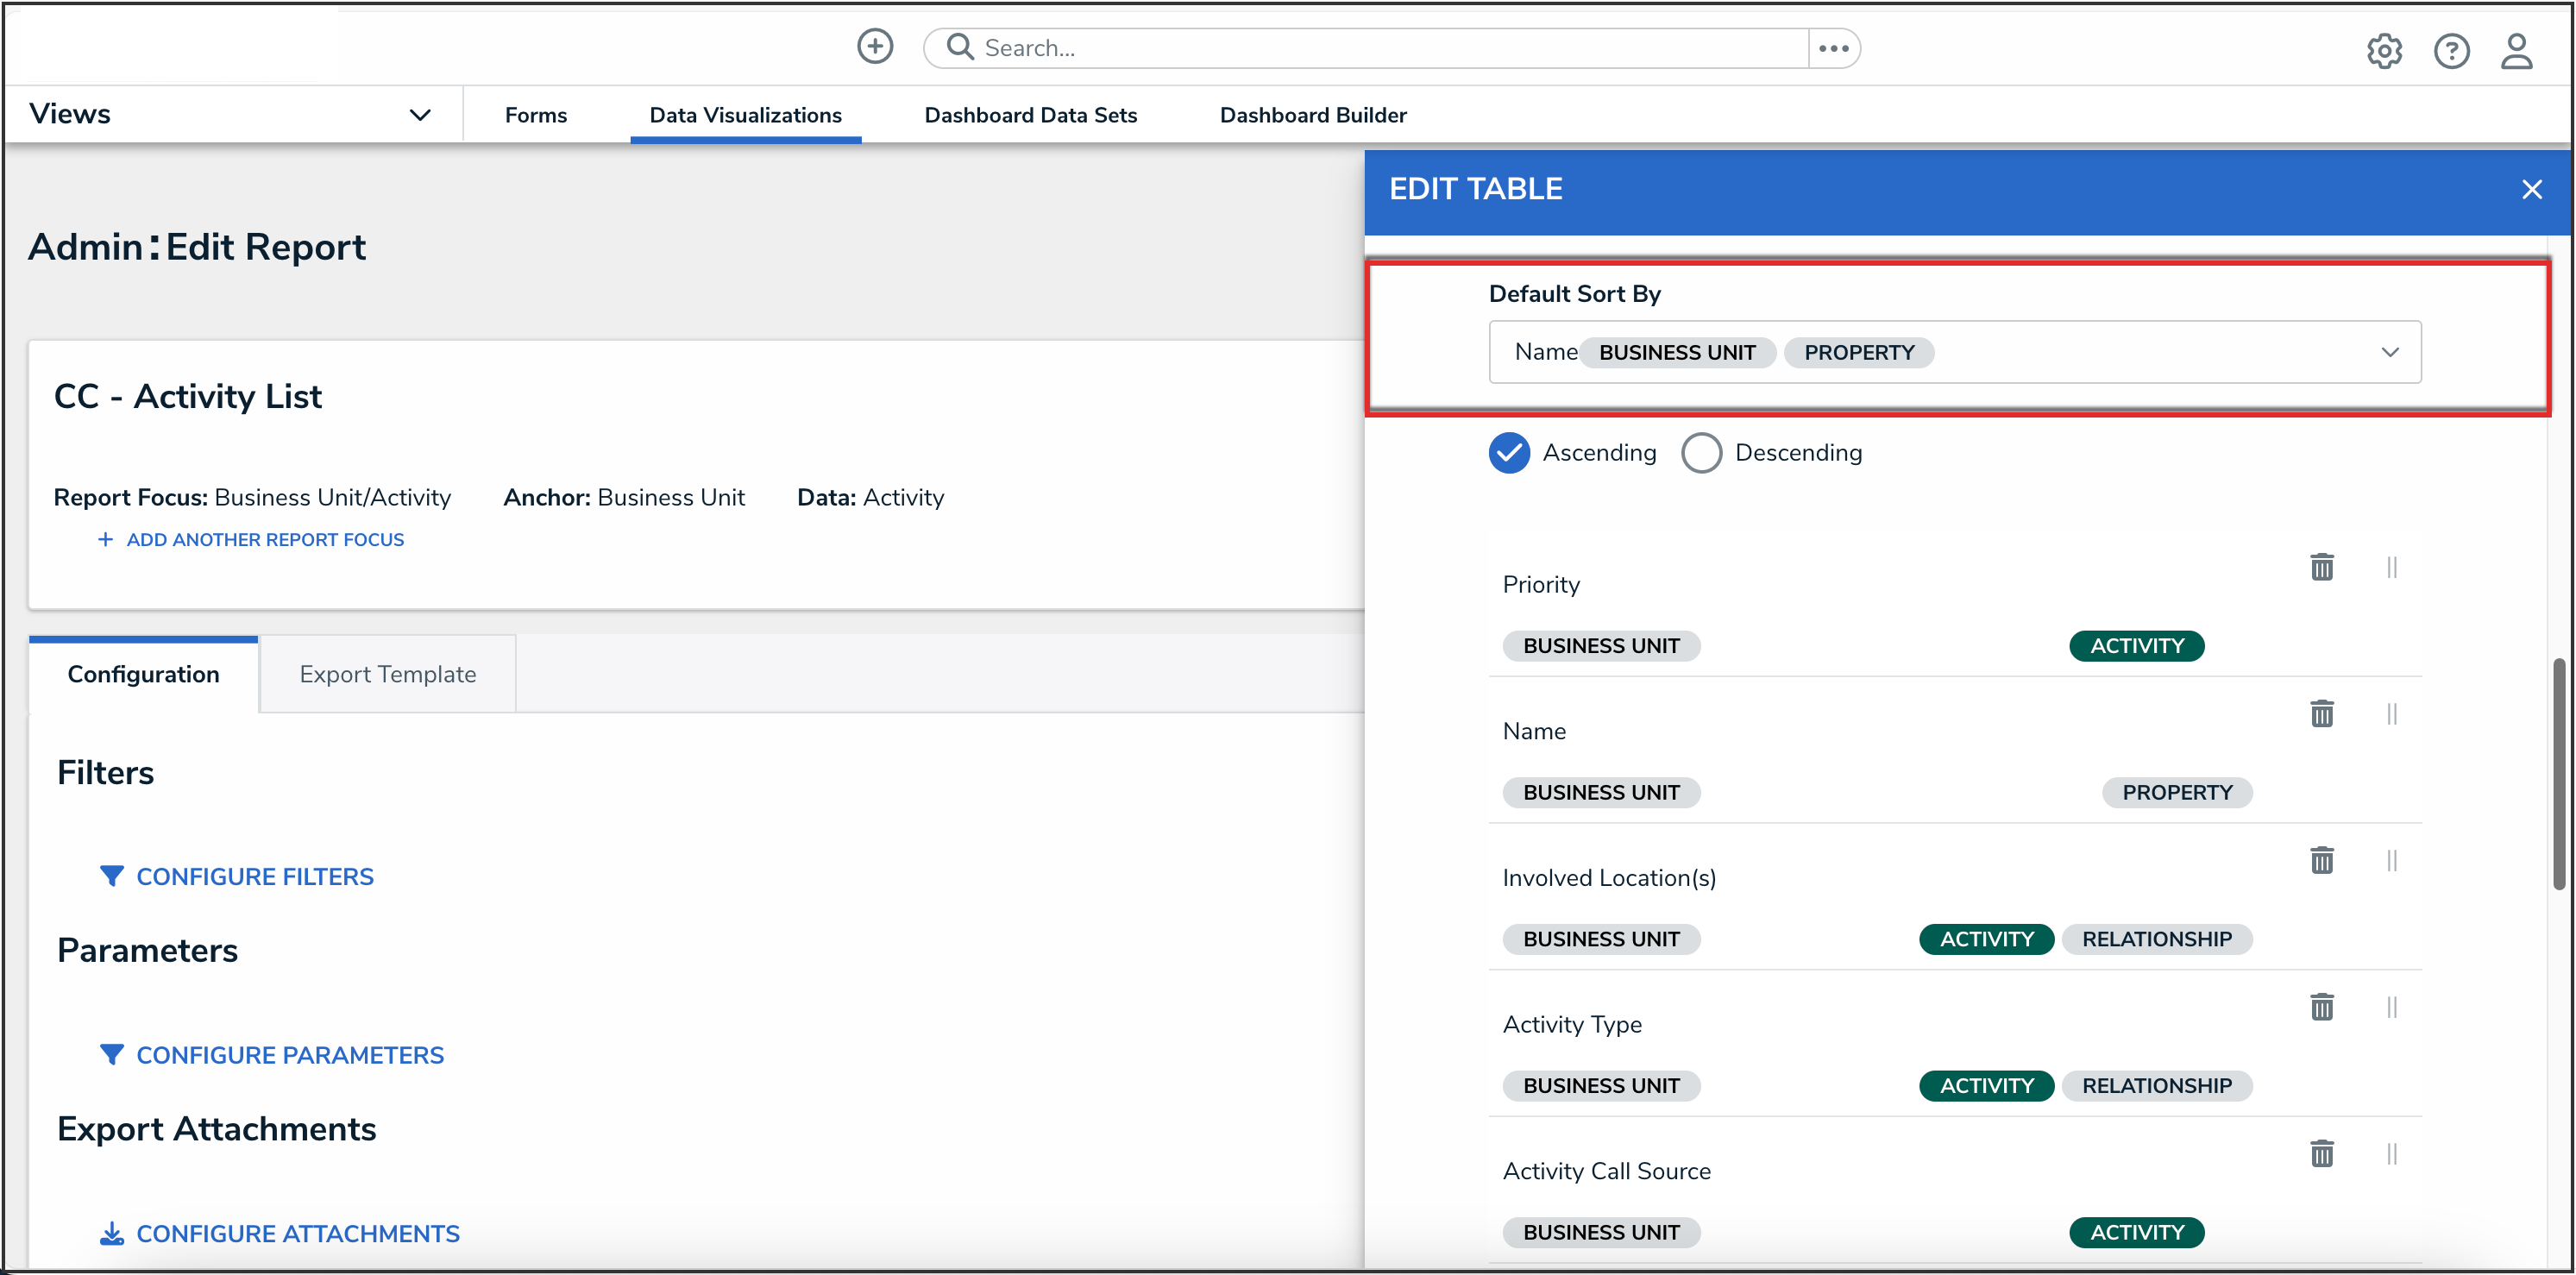
Default Sort By Drop-down Menu
- Select Ascending or Descending to choose which sort order the columns will appear as.
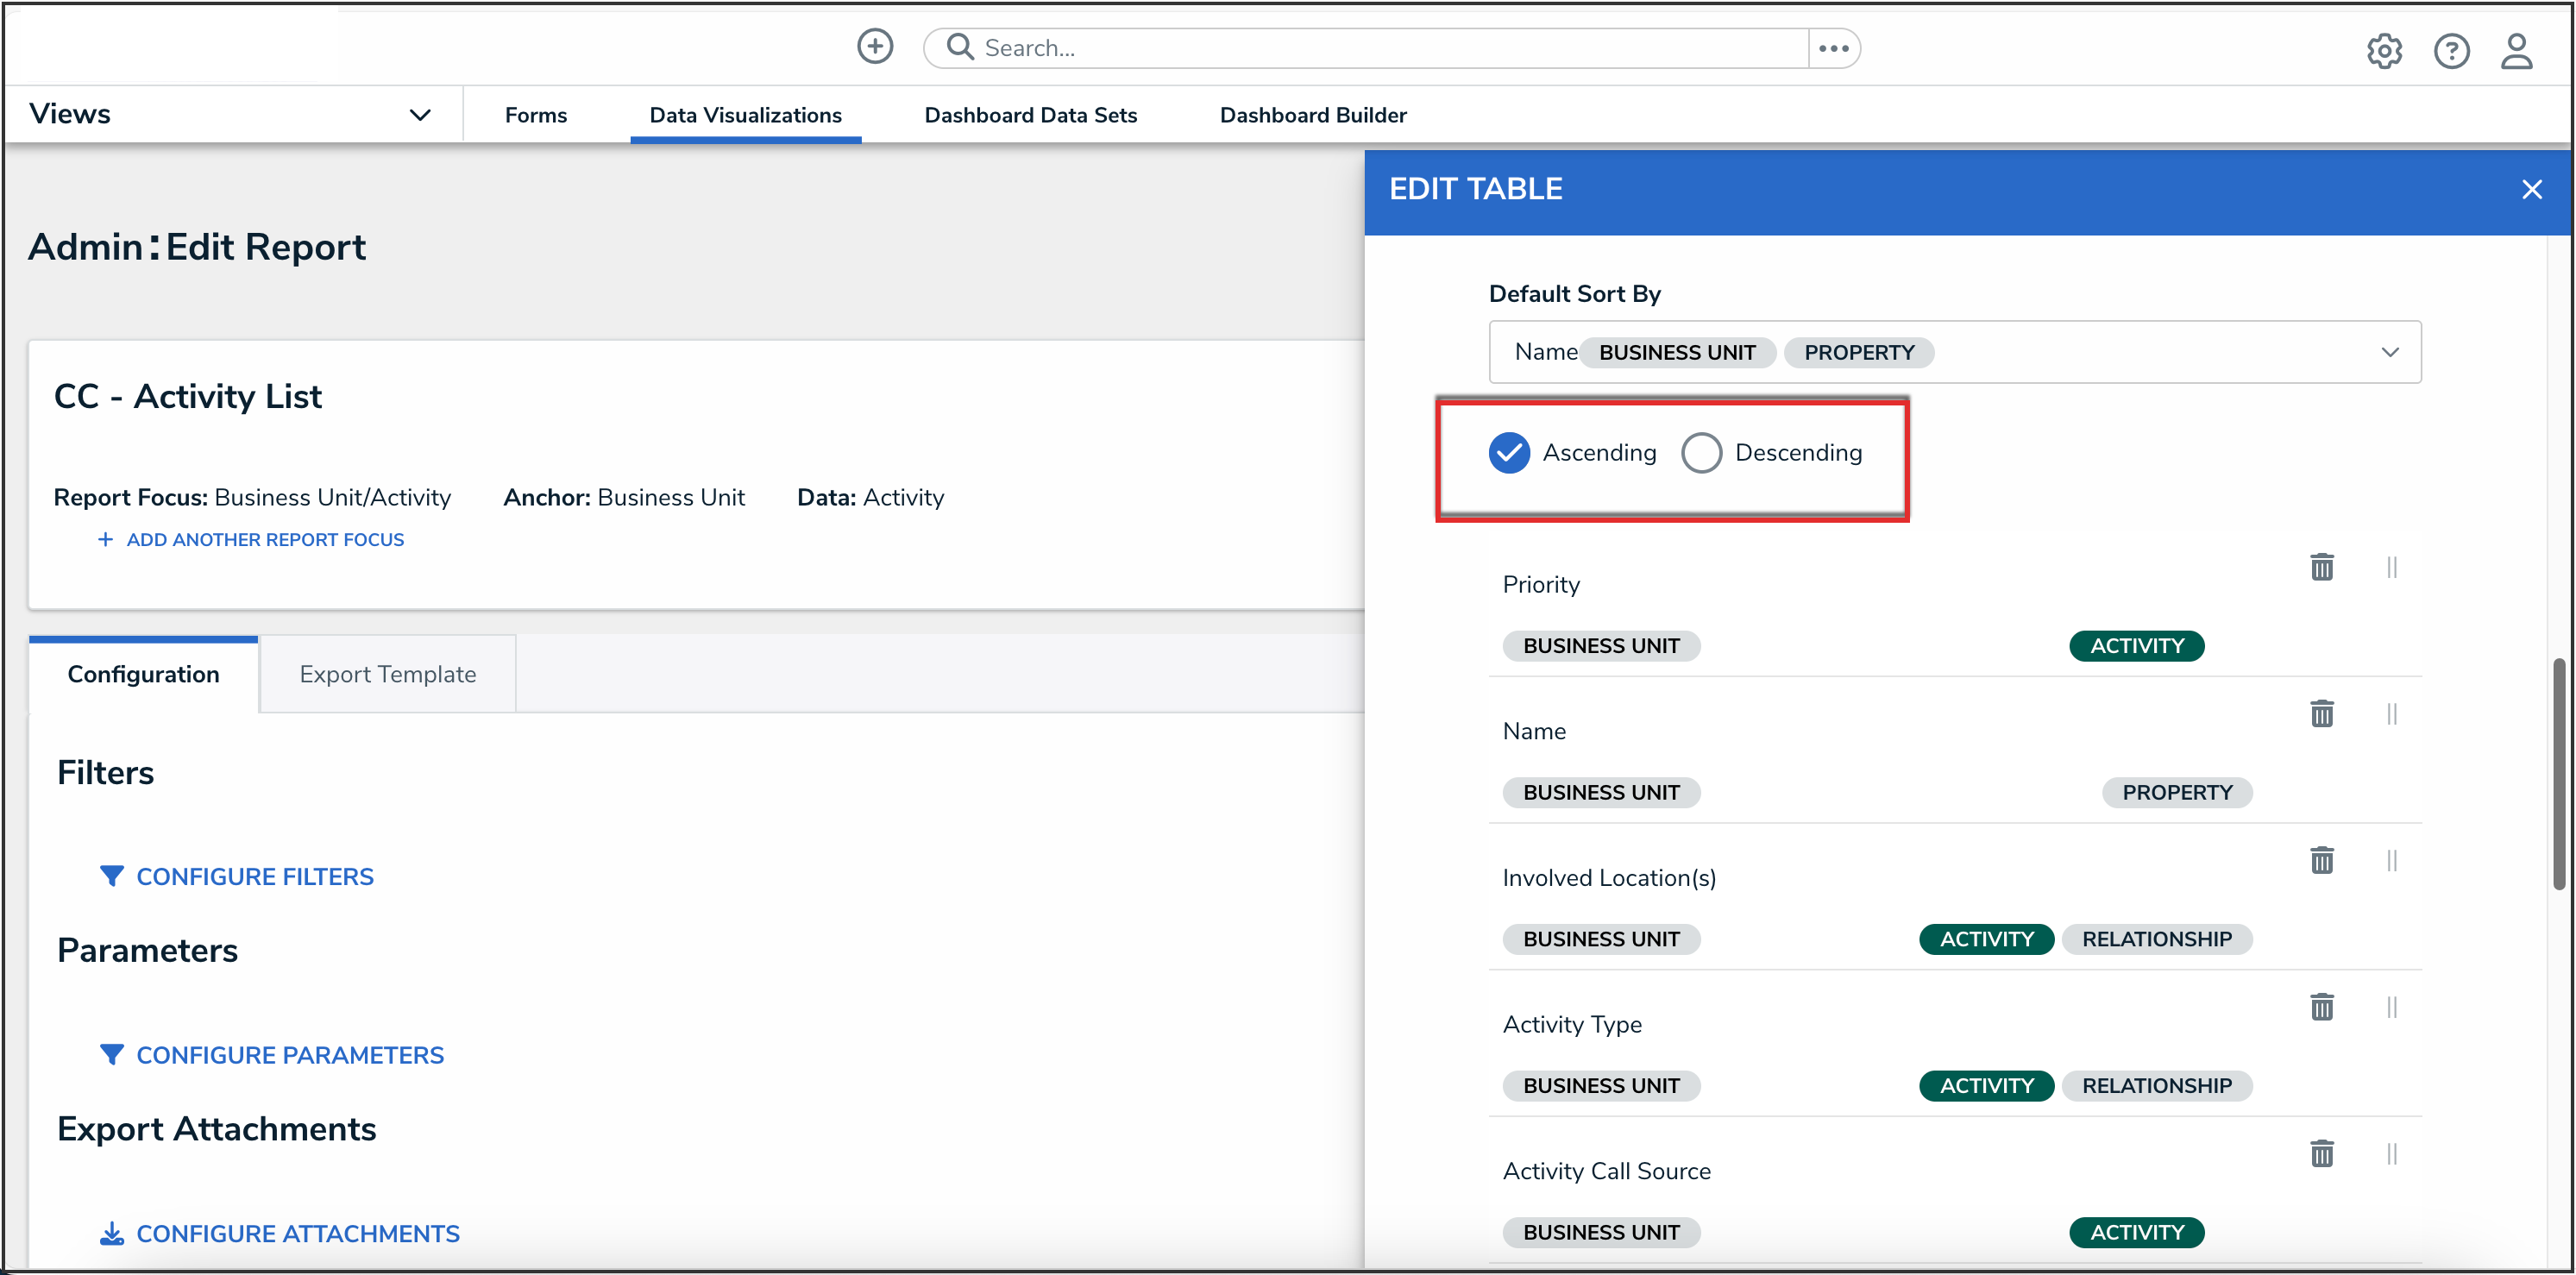
Ascending or Descending
- (Optional): Select the Show SUM totals for all numeric columns checkbox will display the total value of all numeric fields on the table.


Show SUM total for all numeric columns
- (Optional): Select a Display option radio button.

Display Options Radio Buttons
- (Optional): Select the Display Colored Cells radio button to display formulas or select list cells with text and full background color.
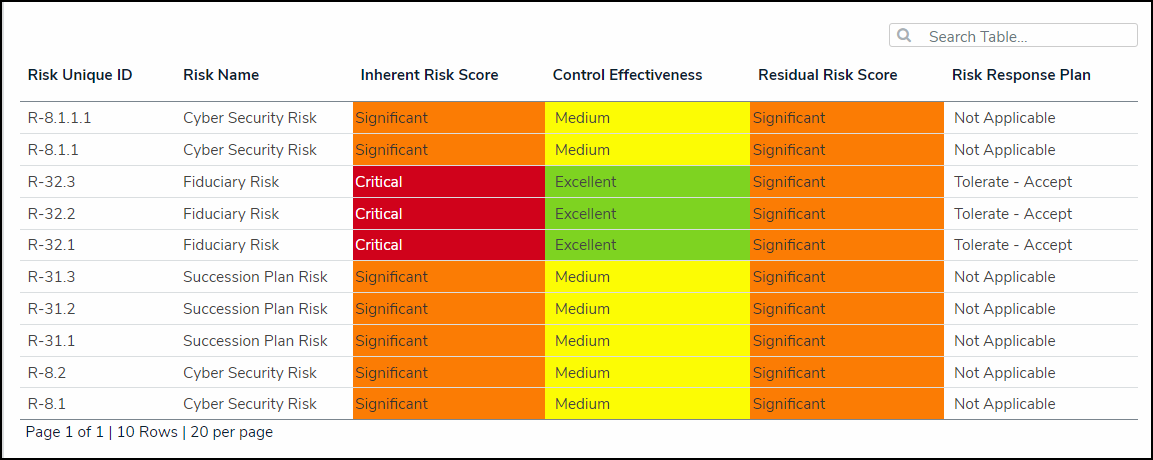
Display Colored Cells
- (Optional): Select the Display Colored Ovals radio button to display formulas or select list cells as text with colored circle background.
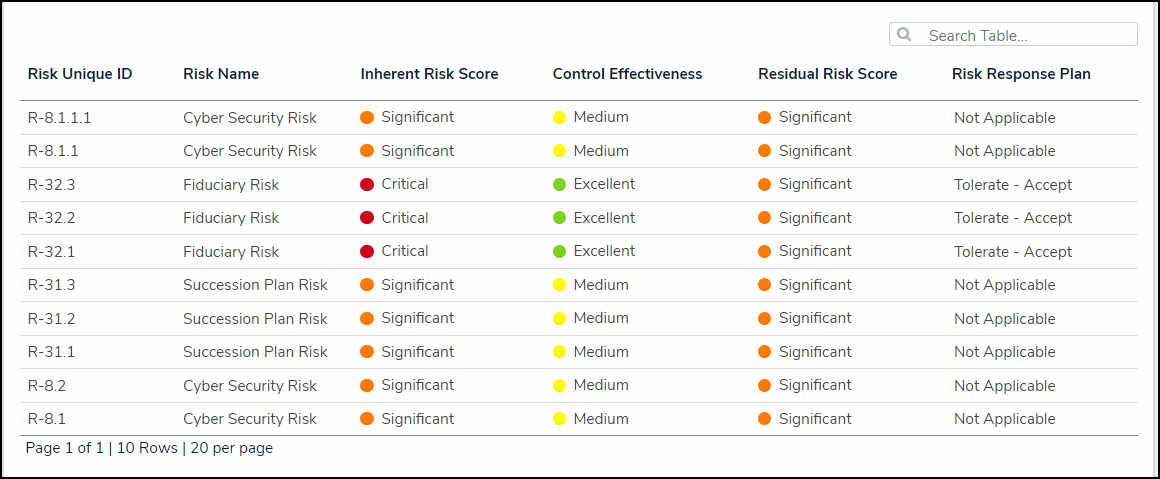
Display Colored Ovals
- (Optional): Select the Display No Color radio button to display formulas or select list cells as text with no background.
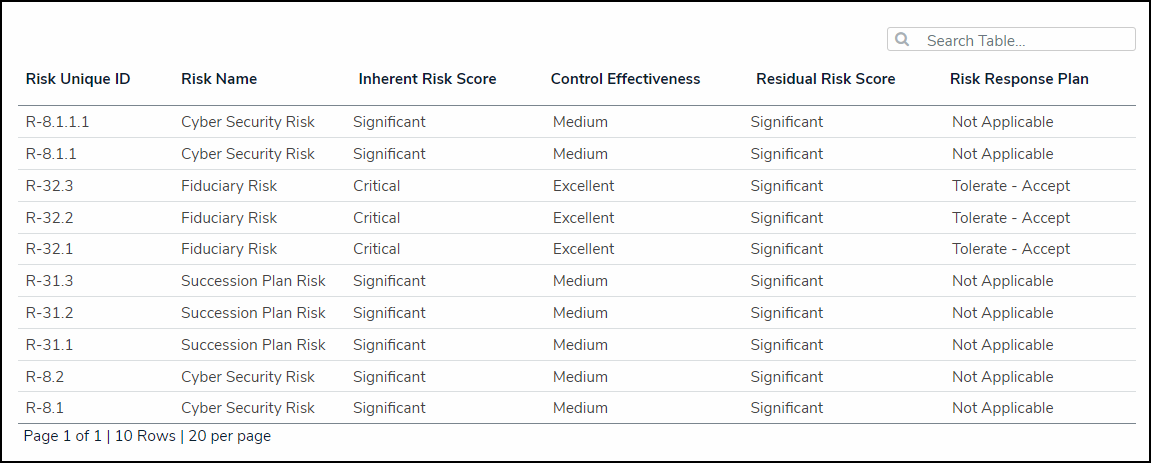
Display No Color
- Click the Parameters tab.

Parameters Tab
- From the Parameters tab, select a relationship from the Select a Relationship dropdown menu. The relationship selected controls the data that appears on the Select Data dropdown menu.

Select a Relationship Dropdown Menu
- Users can apply parameters that use workflow states, formula ranges, select list options, or roles to filter what data is displayed on the table. Parameters can be applied to a table using relationships saved to the table’s data definition but not references.
 Note:
Note:
Tables with more than 10,000 data rows will not load correctly. Resolver recommends that filters or parameters are applied to filter the data and prevent errors.
- Under the Define Parameters section, enter parameters in the following field types to filter the data displayed in the Table:
- By Workflow State: Filter the table data by the various Workflow State stages (e.g., Create, Triage, Review, Investigate, Close).
- By Select List Values: Filter the table data by Select List values. A Select List is a field type that allows users to select one or more options (e.g., dropdown menu).
- By Formula Range: Filter the table data by formula range (e.g., Low, Medium, High). A Formula uses numeric and variable values (e.g., select lists, numeric or date fields, or workflow states) to generate Incident Severity, Estimated Damage, or Incident Likelihood. Formulas are added to an Object Type through a Relationship or Reference.
- By Current Users: Filter the table data by user or user group. When one or more user groups are selected, only users within those roles can view the data in the table. This feature is useful to create customized reports for specific users. The Object Types in the Table's data series determines the available roles.
- By Date and Time: Filter the table data by Date and Time range. All date-related options filter data in UTC (Universal Time Coordinated). Resolver recommends a date parameter to refine large data sets for improved report performance. Options include:
- Today: Show data from today's date only.
- Last [X] Days: Show data within the last 30, 60, 90, or 180 days relative to today.
- Custom: Shows data within the dates selected in the From and To fields. The table will include objects up to the end of that date.
- By Created On/Modified On: Filter the table data by Created On/Modified On Date. All date-related options filter data in UTC. Resolver recommends a date parameter to refine large data sets for improved report performance. Options include:
- Today: Show data from today's date only.
- Last [X] Days: Show data within the last 30, 60, 90, or 180 days relative to today.
- Custom: Shows data within the dates selected in the From and To fields. The table will include objects up to the end of that date.

Define Parameter Fields
- Click the x icon next to a parameter to remove it from the Table.
- Click a Date Parameter field and use the Backspace or Delete key to remove the value from the field.
- (Optional): Select the Show SUM totals for all numeric columns checkbox will display the total value of all numeric fields on the table.

Show SUM Totals for all Numeric Columns Checkbox
- Click Done to close the Edit Table screen.

Done Button
- When you are done adding elements and configuring your report, you must add it to a report view to make it available to end-users. See the Views Overview and Create a Report View articles for more information.