Overview
The Layers function on the Chart screen is available for most Chart Types. The Layers function allows users to set up Trends and Reference Lines over top of a Chart which helps predict future trends.
 Note:
Note:
Pie, Table, Extended Tables, Crosstabs, Maps, Box & Whiskers, and Word Cloud Chart types do not support the Layers function.
User Account Requirements
The user account you use to log into Resolver must have Administrator permission to apply Layers to a Chart
Related Information/Setup
To add styles to your Chart, please see the link below:
Please see the corresponding articles below for Information on Adding a Chart Type not covered by these instructions.
- Adding a Chart to a Dashboard
- Adding a Multi-Series Chart to a Dashboard
- Adding a Combo Chart to a Dashboard
- Adding a Table to a Dashboard
- Adding a Crosstab to a Dashboard
- Adding a Heatmap to a Dashboard
- Adding a Map to a Dashboard
- Adding a Box and Whiskers Chart to a Dashboard
Navigation
- From the Home screen, click the Administration icon.
![]()
Administration Icon
- From the Administrator Settings menu, click the Admin Overview link.
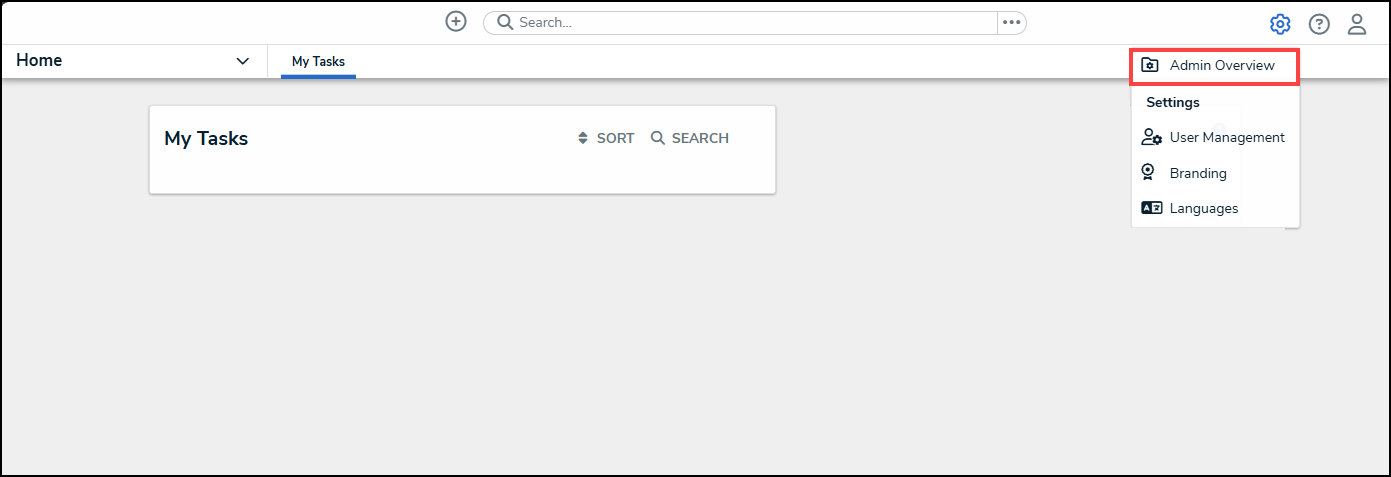
Administrator Settings Menu
- From the Admin Overview screen, click on the Dashboard Builder tile under the Views section.

Dashboard Builder Tile
- From the Dashboard Builder screen, click a Dashboard Name.
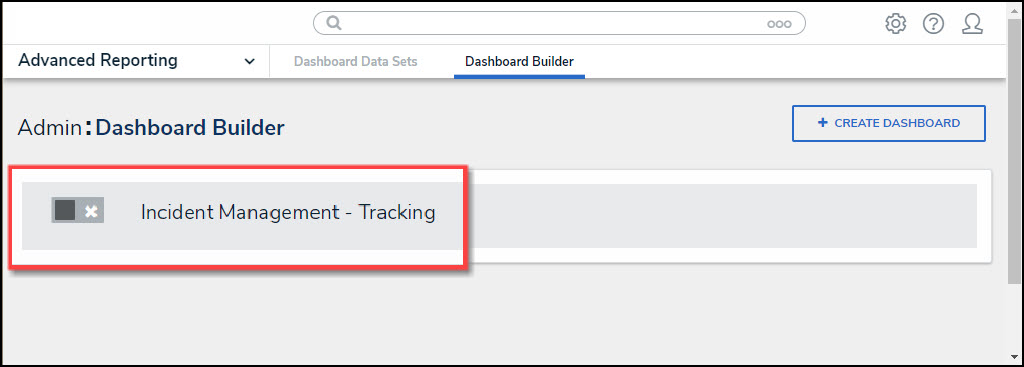
Dashboard Name
- From the Dashboard screen, to access the Chart screen, click on the Add Chart button.

Add Chart Button
- Or click the More Options icon on an existing Chart View.

More Options Icon
- Click the Edit option from the More Options dropdown menu.

Edit Option
- From the Chart screen, click the Layers panel from the Configuration panel.

Layers Panel
Applying a Trend Line to a Chart
A Trend Line shows the data direction in a Chart and helps to identify patterns to allow for accurate predictions.
- Click the Trend Line panel.

Trend Line Panel
- Click the Type dropdown and select a Trend Line Type:

Type Dropdown
- None: No Trend Line is applied to the Chart.
- Standard Linear Regression: A Standard Linear Regression displays whether the data values increasing or decreasing using a straight line to represent the trend (e.g., sales).
- Exponential: An Exponential type is best when the data values increase or decrease at elevating higher values. You cannot use the Exponential type if the Data Set has negative or 0 values.
- Logarithmic: A Logarithmic type is best when the data values sharply increase or decrease and level out to a plateau. You can use the Logarithmic type with negative and positive data values (e.g., growth)
- Moving Average Trend: The Moving Average Trend type displays data value trends more clearly when data values have multiple increases and decreases.
- Polynomial: A Polynomial type is best to use when the data values fluctuate (e.g., gains and losses).
- Select a Line Thickness by clicking one of the corresponding buttons (Thin, Normal, or Bold).

Line Thickness
- Select a Line Style by clicking one of the corresponding buttons (Solid, Dashed, or Dotted).

Line Style
- Click the Save Chart button to save changes to the Chart.
Save Chart Button
Applying a Reference Line to a Chart
A Reference Line allows a user to create a line of reference on the Chart to measure, compare, or reference the data values. You can add multiple Reference Lines on a Chart.
- Click the Reference Line panel.

Reference Line Panel
- Click the + Add Reference Line link.
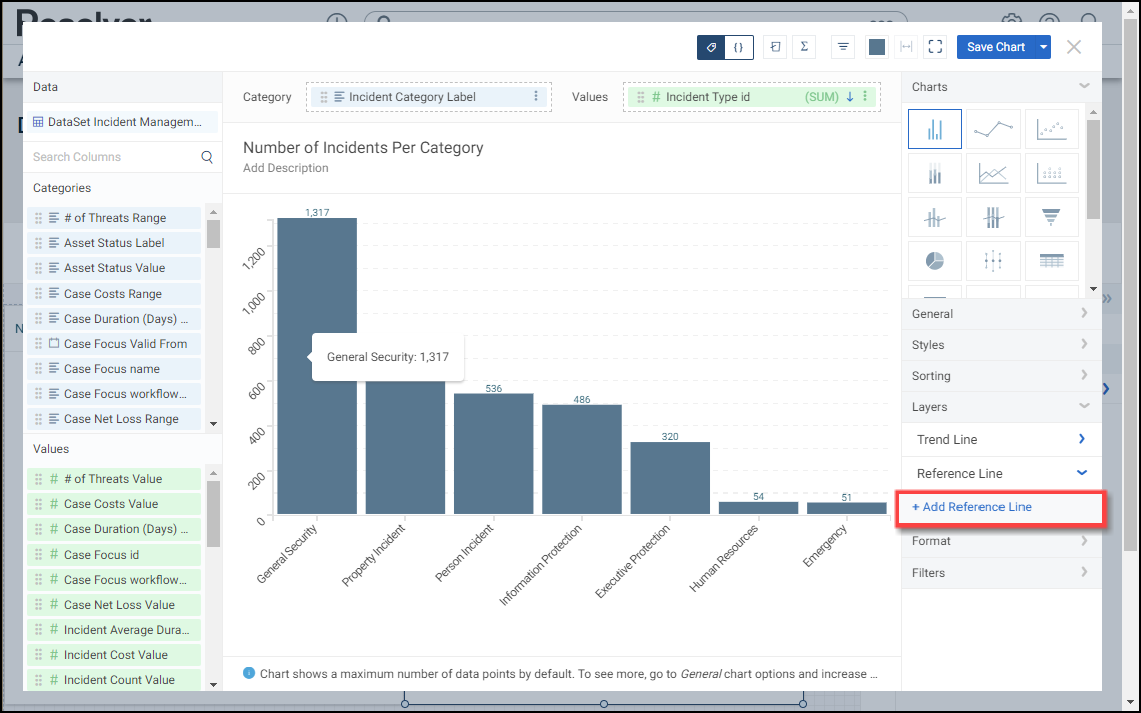
+ Add Reference Line Link
- A Reference Line will be added to the Chart across the 0 y-axis.

Reference Line
- Click the Reference Line 1 panel.

Reference Line 1 Panel
- Select a Reference Line Type by clicking on one of the Reference Line Type buttons:

Reference Line Type
- Fixed: A Fixed Reference Line allows a user to enter a fixed value setting the Reference Line on the Chart at the specific value.
- Value: Enter the Value where you want the Reference Line to appear on the Chart in the Value field, or use the increase and decrease arrows to set the value. When the Fixed button is selected the Value field will appear under the Reference Line Type buttons.
- Dynamic: A Dynamic Reference Line allows a user to apply an aggregate to the data values on the Chart to calculate the location of the Reference Line on the Chart.
- Value Aggregate: Select a Value Aggregate type from the dropdown menu. When the Dynamic button is selected the Value Aggregate field will appear under the Reference Line Type buttons.
- Sum: The Sum type adds values together.
- Average: The Average type is a single value that represents a larger set of values, which is the sum of the numbers divided by the number of digits in the Data Set.
- Median: The Median type is the middle value of a Data Set.
- Count: The Count type finds the number of values in a finite Date Set.
- Distinct Count: The Distinct Count finds specific values within a Data Set.
- Minimum: The Minimum type determines the smallest number in the Data Set.
- Maximum: The Maximum type determines the largest number in the Data Set.
- Value Aggregate: Select a Value Aggregate type from the dropdown menu. When the Dynamic button is selected the Value Aggregate field will appear under the Reference Line Type buttons.
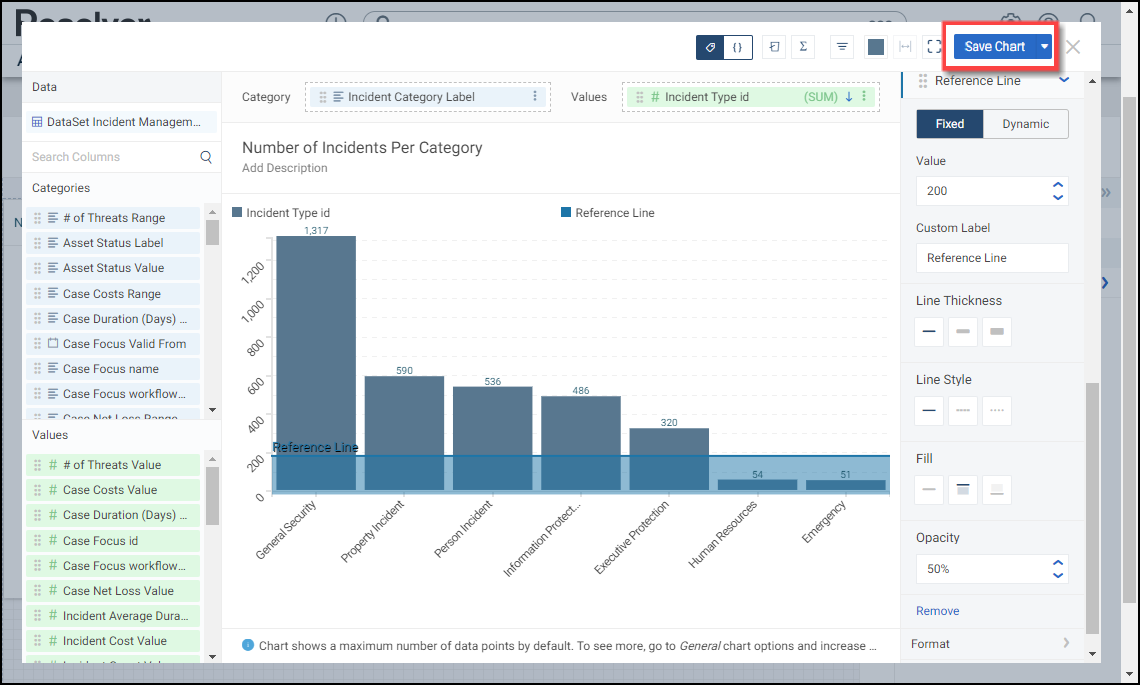
- Click the Custom Label field and enter a label for the Reference Line. Custom Labels will appear above the Reference Line on the Chart and in the Charts legend.

Custom Label
- Select a Line Thickness by clicking one of the corresponding buttons (Thin, Normal, or Bold).
- Select a Line Style by clicking one of the corresponding buttons (Solid, Dashed, or Dotted).
- Select a Fill option by clicking one of the corresponding buttons:
- None: No fill is added to the Chart.
- Before: The Before option adds a fill or tint to the Chart filling the area before the Reference Line.
- After: The After option adds a fill or tint to the Chart filling the area after the Reference Line.

Fill Before Option
- Enter an Opacity value in the Opacity field to increase or decrease the Fill opacity or use the increase and decrease arrows to set the value.

Opacity Field
- Click the Remove link to delete the Reference Line from the Chart.
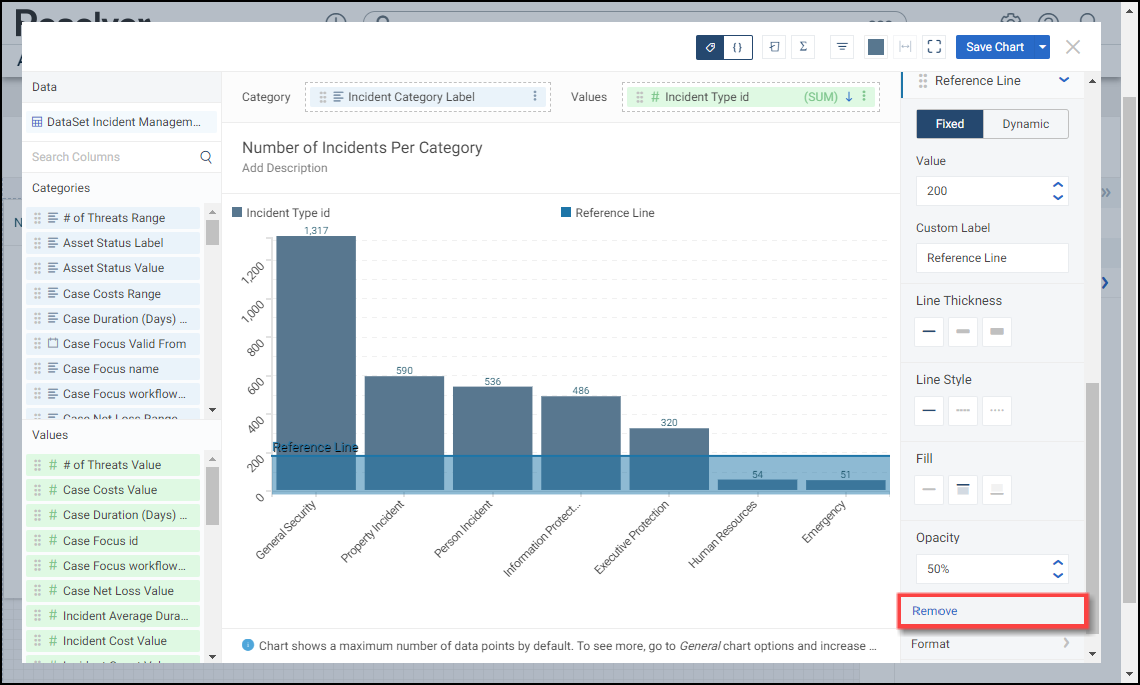
Remove Link
- Click the + Add Reference Line link to add another Reference Line to the Chart.

+Add Reference Line Link
- Click the Save Chart button to save changes to the Chart.
Save Chart Button