Overview
Administrators and Data Management advanced permissions users can create a new Data Grid. A Data Grid is a data visualization that displays object data in a spreadsheet-style format.
You can create custom data grids for the currently logged in user (e.g. My Incidents or My Risks) by applying the Current User parameter to the data grid element. See step 24 below for more information.
User Account Requirements
The user account used to log into Resolver must have Administrator permission or Data Management advanced permissions to create a Data Grid.
Related Information/Setup
Please refer to the Create a Date Grid View article for more information on creating a Data Grid View.
Navigation
- From the Home screen, click on the Administration icon.
![]()
Administration Icon
- From the Administrator Settings menu, click Admin Overview.

Administrator Settings Menu
- From the Admin: Overview screen, click the Data Visualizations tile under the Views section.
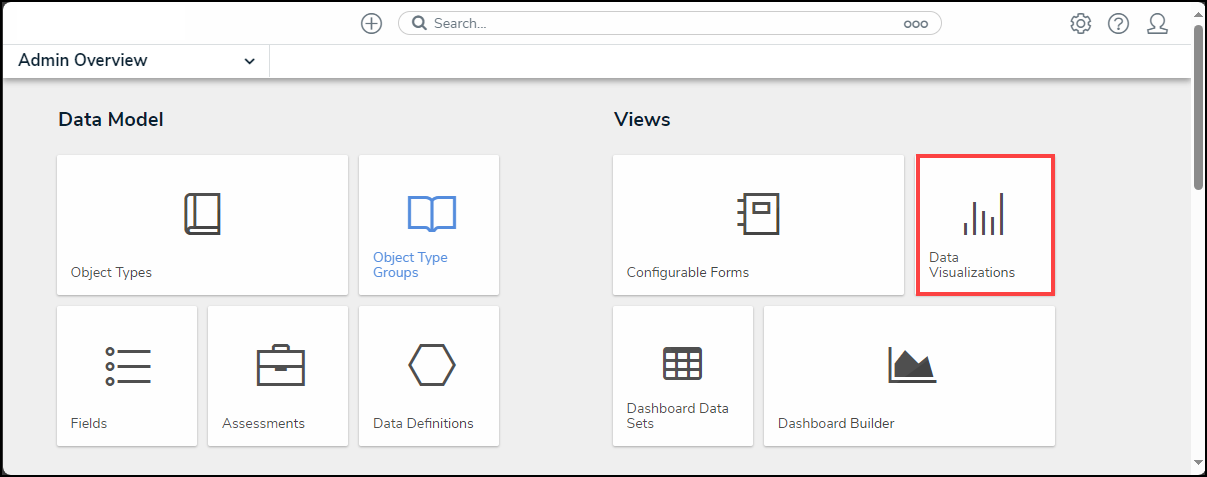
Data Visualizations Tile
- From the Admin: Data Visualizations screen, click the + Create Data Visualizations button.

+ Create Data Visualizations Button
Creating a New Data Grid
Ensure the data definition you wish to use for data grid has been created from the Data Definitions settings in Administration.
- From the Admin: Create Data Visualization screen, enter a Data Grid Name in the Name field. The name will represent the Data Grid throughout the system.

Name Field
- (Optional) Enter a brief description of the Data Grid in the Description field. The description will appear below the Data Grid's name on the Admin: Data Visualization screen.

Description Field
- Click the Type field and select Data Grid from the dropdown menu.

Type Dropdown Menu
- Click the Data Visualization Focus field and select a focus from the dropdown menu. Enter the name of the focus in the Data Visualization Focus field to narrow the focus list. Users can select more than one focus in the Data Visualization Focus field. A Data Visualization Focus is a data definition that broadly specifies which object type’s data will be displayed in a data visualization.

Data Visualization Focus Field
- Click the Create button to create the Data Grid.

Create Button
- From the Admin: Edit Data Grid screen, on the Elements section, click the Expand icon next to Display.
![]()
Expand Icon
- Drag and drop the Data Grid link from the Elements section to the Data Grid Canvas.

Drag and Drop Data Grid Link
- From the Add Data Grid screen, enter a data definition name in the Select a Data Series field to narrow the list.

Select a Data Series Field
- Select a data definition from the Select a Data Series field dropdown menu. The data definition selected here will determine the object data you can display in the Data Grid.

Select a Data Series Field Dropdown Menu
- Click the Done button.

Done Button
- From the Data type tab on the Edit Data Grid pop-up, by default, the Select All checkbox is selected, which will include all data types on the Data Grid. To select individual data types, deselect the Select All checkbox and click on the data types you want to appear on the Data Grid.

Select All Checkbox
- Choose the Data Types that will appear on the Data Grid from the Select Your Data Type field.

Select Your Data Type Field
- Select Library Data from the Select Your Data Type field to also include object type data on the Data Grid.

Library Data
- Click the Columns tab.

Columns Tab
- From the Columns tab, select a Relationship from the Select a Relationship field dropdown menu. Users can choose either the Data Grid Anchor or an Object Type in the data path. The options in the Select a Relationship dropdown menu will vary depending on the data series selected.

Select a Relationship
- (Optional) Click the Search field to narrow the search results on the Select Data list.

Search Field
- Click on the Data Columns to select the columns that will appear on the Data Grid (e.g., properties, workflow states, fields, formulas, relationships) from the Select Data list.

Select Data List
- From the Define Custom Forms section, select the Object can be accessed in the palette from data grid checkbox to enable an icon that appears when hovering a cursor over the Name column in the Data Grid. Clicking the icon displays the object in a pop-up. Users will not be able to view objects in a pop-up if the Name property isn't displayed in the data grid.

Object can be Accessed in the Palette from Data Grid Checkbox
- If you selected the Object can be accessed in the palette from data grid checkbox the Select Form dropdown menu will appear. Select a form from the dropdown menu to choose which form is displayed when the user clicks the palette icon.

Select Form Dropdown Menu
- From the Sort Columns section, users can perform the following actions:
- (Optional) Click the Read Only Icon to prevent users from editing a Data Grid cell.
- (Optional) Click the Delete icon to remove a column from the Data Grid.
- (Optional) Click the Move icon to rearrange the columns on the Data Grid.

Sort Columns Options
- (Optional) Click the Mark all columns as read-only checkbox to automatically mark all Data Grid columns as read-only, preventing users from editing a Data Grid cell.

Mark all columns as read-only Checkbox
- (Optional) Select a Display option radio button.

Display Options Radio Buttons
- (Optional) Select the Display Colored Cells radio button to display formulas or select list cells with text and full background color.
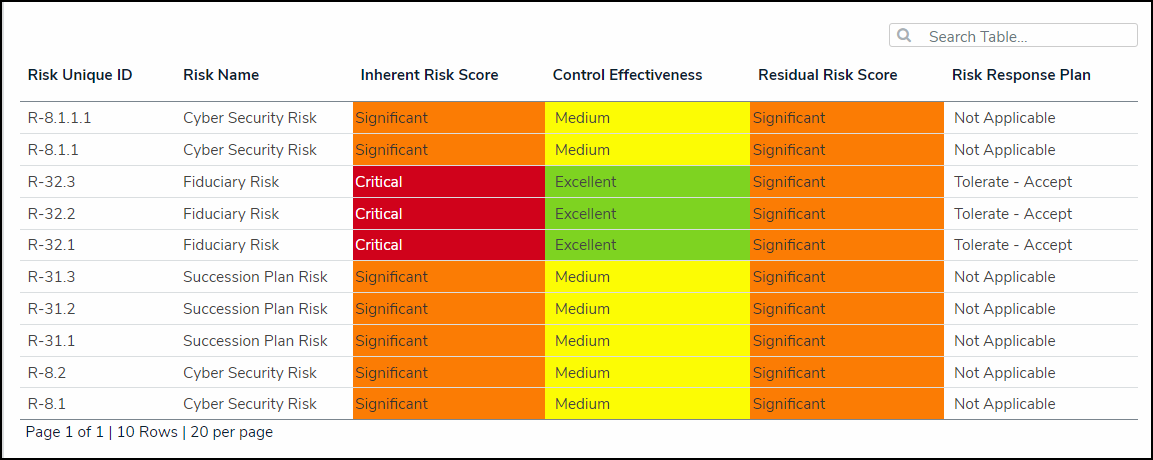
Display Colored Cells
- (Optional) Select the Display Colored Ovals radio button to display formulas or select list cells as text with colored circle background.
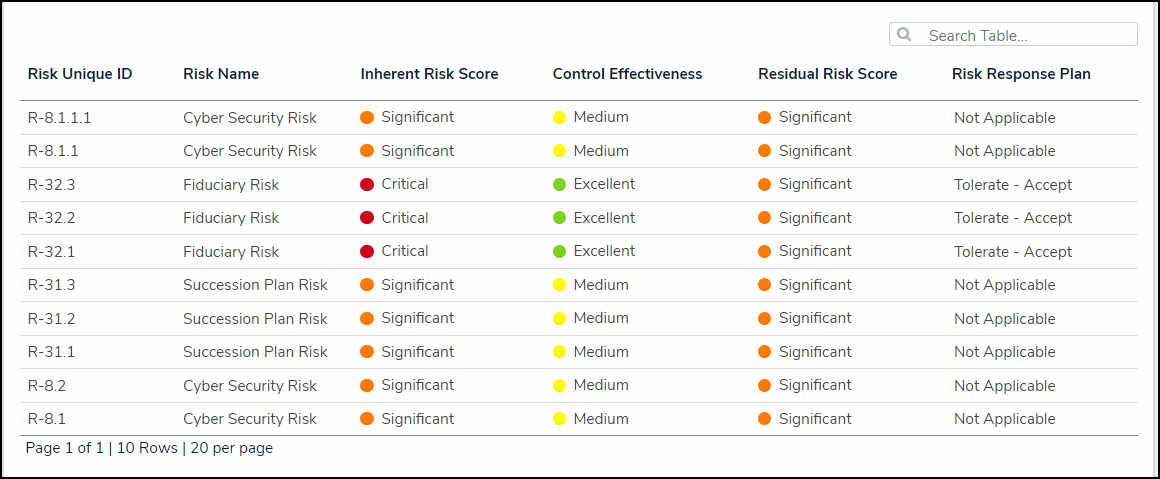
Display Colored Ovals
- (Optional) Select the Display No Color radio button to display formulas or select list cells as text with no background.
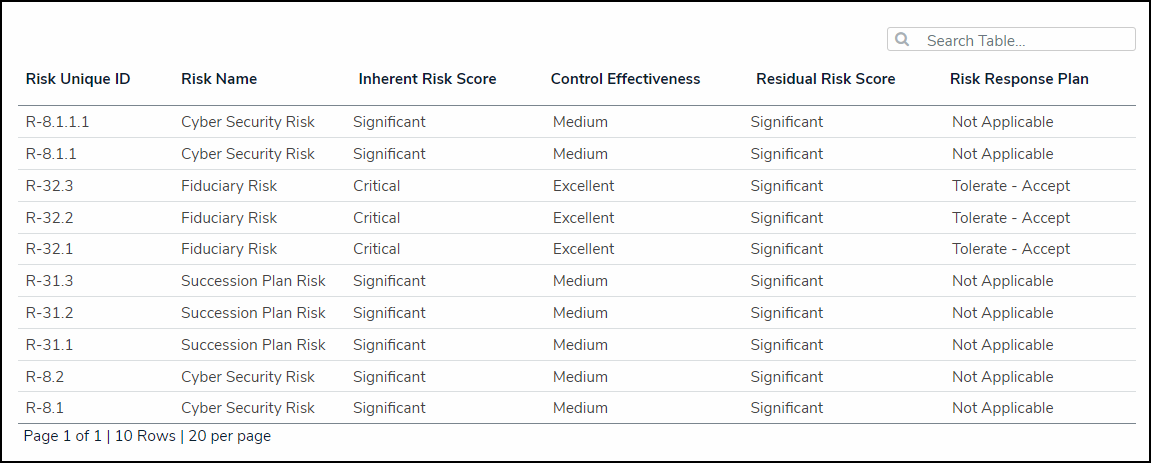
Display No Color
- Click the Parameters tab.

Parameters Tab
- From the Parameters tab, select a Relationship from the Select a Relationship dropdown menu. The relationship selected here will determine which parameters (filters) you can apply to the Data Grid to refine the data that’s displayed. If needed, you can select a relationship that differs from the relationship selected in the Columns tab.

Select a Relationship Dropdown Menu
- From the Define Parameters section, select one or more parameters to filter the data displayed in the Data Grid. Parameter options include:
- Workflow states
- Select list options
- Formula ranges (e.g. High, Medium, Low)
- Current User. When one or more roles are selected in this parameter, only users within those roles can view the data in the grid. This feature is useful to create customized data grids for specific users. The available roles are determined by the object types in the table's data series
- Date & Time Field or Created On/Modified On properties. Selecting a range in the By [Date Field] dropdown menu will filter the data relative to the value selected in the Date & Time field on the objects. Selecting a range in the By Created On ([Object Type Name]) or By Modified On ([Object Type Name]) dropdown menus will filter the data relative to the date the objects were created or modified. All date-related options filter data in UTC time. It's recommended a date parameter is used to refine large data sets for improved report performance. Options include:
- Today: Show data from today's date only.
- Last [X] Days: Show data within the last 30, 60, 90, or 180 days, relative to today's date.
- Custom: Shows data within the dates selected in the From and To fields. The table will include objects up to the end of that date.

Define Parameters Section
- Click the X icon next to a parameter to delete it from the field.
![]()
X Icon
- Click the Done button to close the Edit Data Grid pop-up. To add another Data Grid, you must create a new Data Grid, only one Data Grid can be added per Data Grid.

Done Button
- Once a grid is successfully created and configured, it must be added to a view in an activity. See the Create a Data Grid View article for more information.