Overview
Trending tables allow users to analyze how objects or values change over multiple timeframes. For example, trending tables could be used by:
- Risk users who compare the current risk score to previous risk scores within a specific timeframe.
- Risk executives to run a repeatable form on a report to review how their top 10 risks are trending.
- Incident users to compare the number incidents logged at a specific location and timeframe.
- Users who review dashboard reports to identify important trends in the data (e.g., Incidents by Location).
Trending data is displayed as a line graph and table on a form and can be configure by weekly, monthly, quarterly, bi-annual, or annual time periods.
Clicking the + Show More link, will display 12 additional data points based on the timeframe you set.

Trending Table
Related Information/Setup
Before you can add a Trending Table you must first create a new standard form. Click the link below to find out more information regarding creating a new standard form:
Trending tables display single select list, numeric field, and formula data in a line graph or table on standard configurable forms and repeatable forms. Click the links below to find out more information regarding the Trending Table display options:
Navigation
- From the Home screen, click the Administration icon.
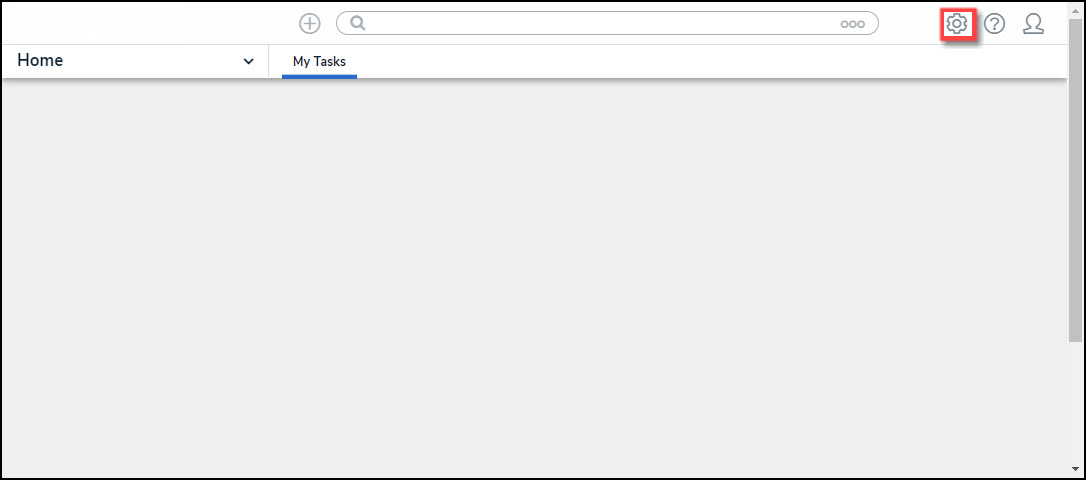
Administration Icon
- From the Admin Overview screen, click the Configurable Forms tile on the Views section.
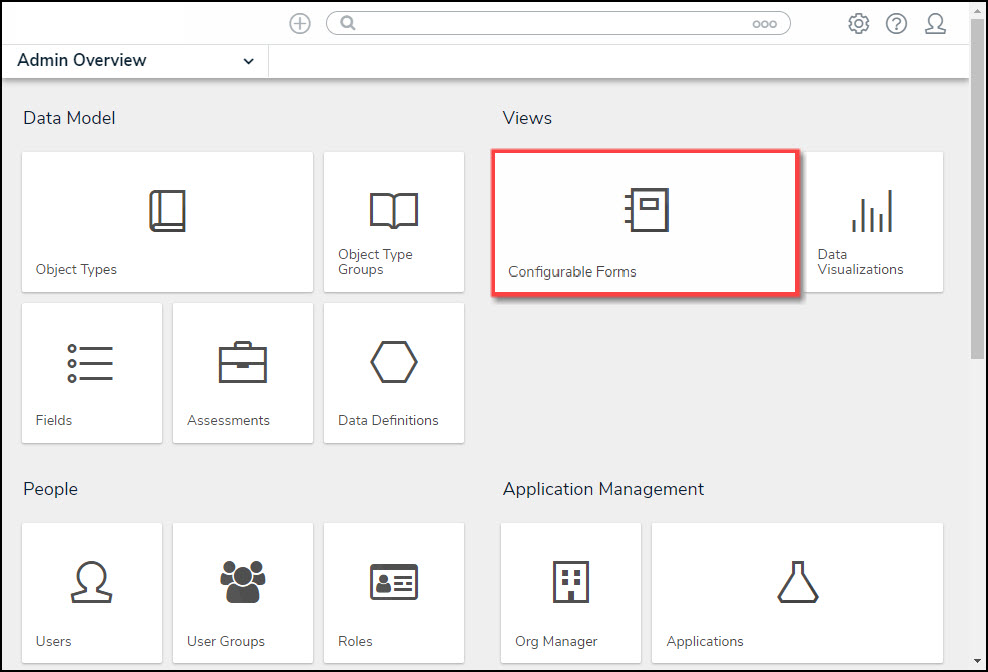
Object Types Tile
- From the Admin: Configurable Forms screen, enter a keyword in the Search field to narrow down the forms list.
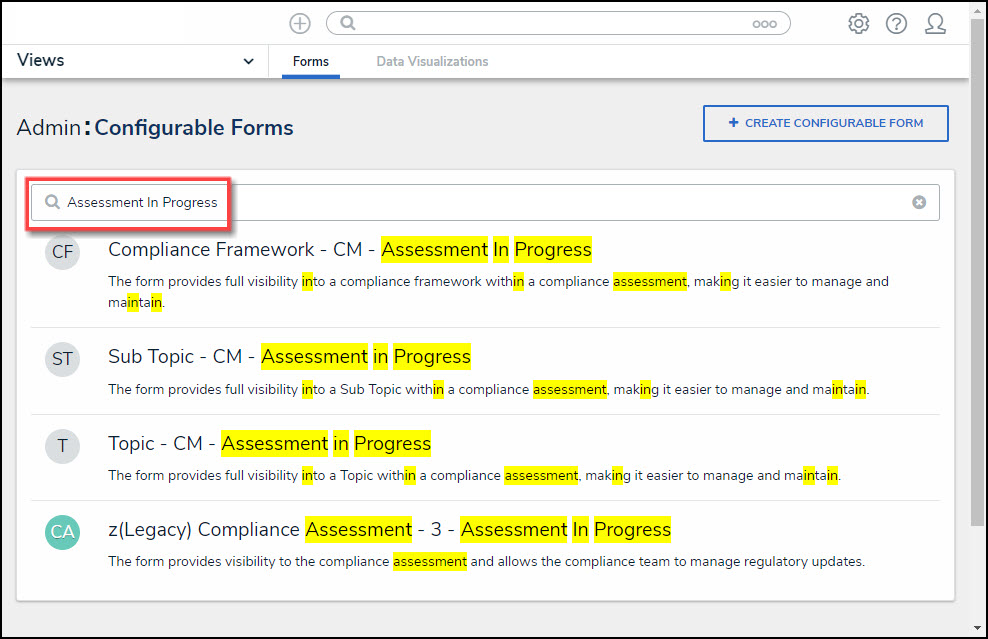
Search Field
- Click on the Name of the form you want to configure.
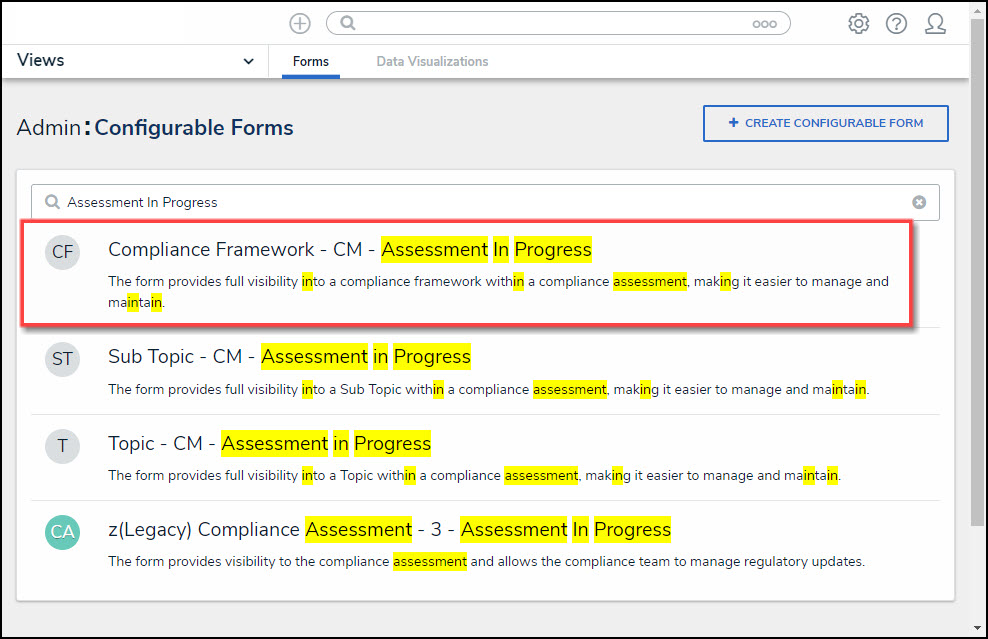
Select a Form Name
Enabling a Trending Table on a Form
Before you can create a Trending Date Table you must ensure the Object Type selected for the form has a single select list, numeric field or formula added to its components.
 Note:
Note:
Recently added fields or formulas may not have enough data to display longer time periods.
- From the Edit Configurable Forms screen, drag and drop the Field or Formula (e.g., Availability Score) from the Form Elements pop-up to a card or section on the canvas.

Drag and Drop Element
- Hover your cursor over the Field or Formula, then click the Edit icon.
![]()
Edit Icon
- From the Edit Component Display screen, scroll down to the Trending table section and click the Enable Trending Table toggle to display the Trending Table options.
 Notes:
Use no more than ten trending elements per form.
A report should not have more than 100 trending elements across all its repeatable forms (a report has 25 repeatable form objects; each form should have four trending objects totaling 100).

Trending Table Toggle
- Select a Format radio button that displays the trending data using a Table, Line Graph, or Both.
- Select a Timeframe from the dropdown list:
- Daily
- Weekly
- Monthly
- Quarterly
- Semiannually
- Annually
 Notes:
The trending form element only shows historical values. Data for the current date will not be included.
The data displayed uses values that are valid at the end of the selected timeframe (March 2019 data is available at 11:59 p.m. on March 31, 2019).
- Click the Close button to save your changes.