Overview
Formulas are elements that calculate numeric data using variables (e.g., Incident Severity, Estimated Damage, or Incident Likelihood).
User Account Requirements
The user account you use to log into Resolver must have Administrator permission to use the Configurable Forms feature.
Related Information/Setup
Before a formula can be added to a form, it must be added to an object type as a component. Read more in the below articles:
Navigation
- From the Home screen, click the Administration icon.
![]()
Administration Icon
- From the Administrator Settings menu, click Admin Overview.
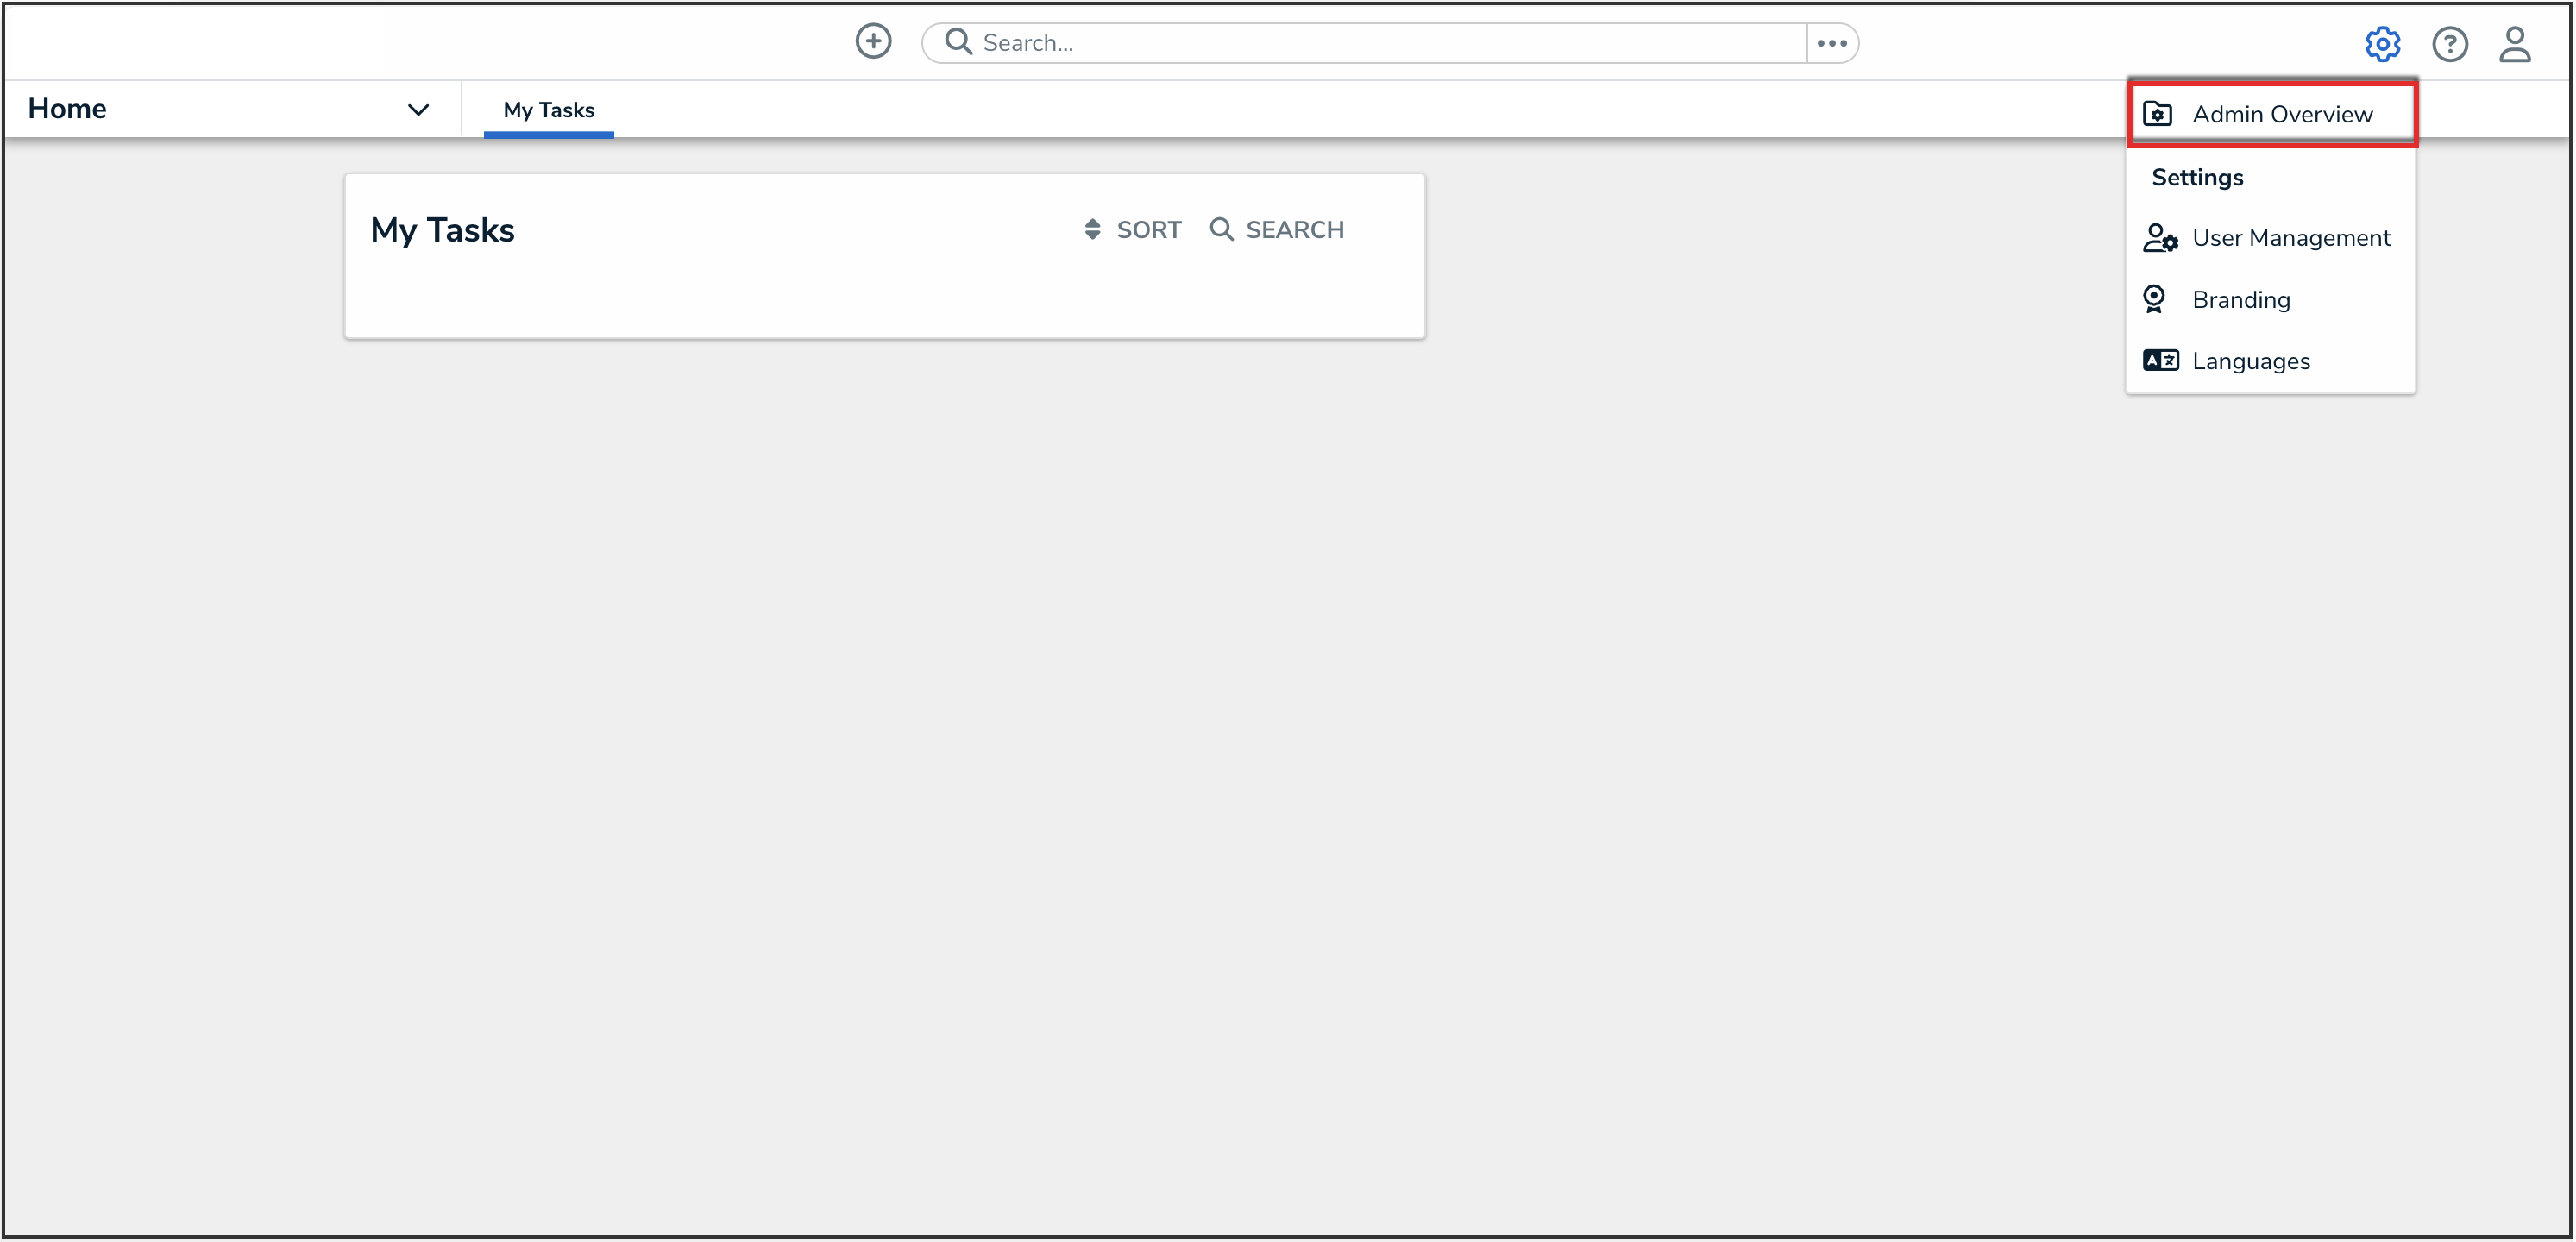
Administrator Settings Menu
- From the Admin Overview screen, click the Configurable Forms tile under the Views section.
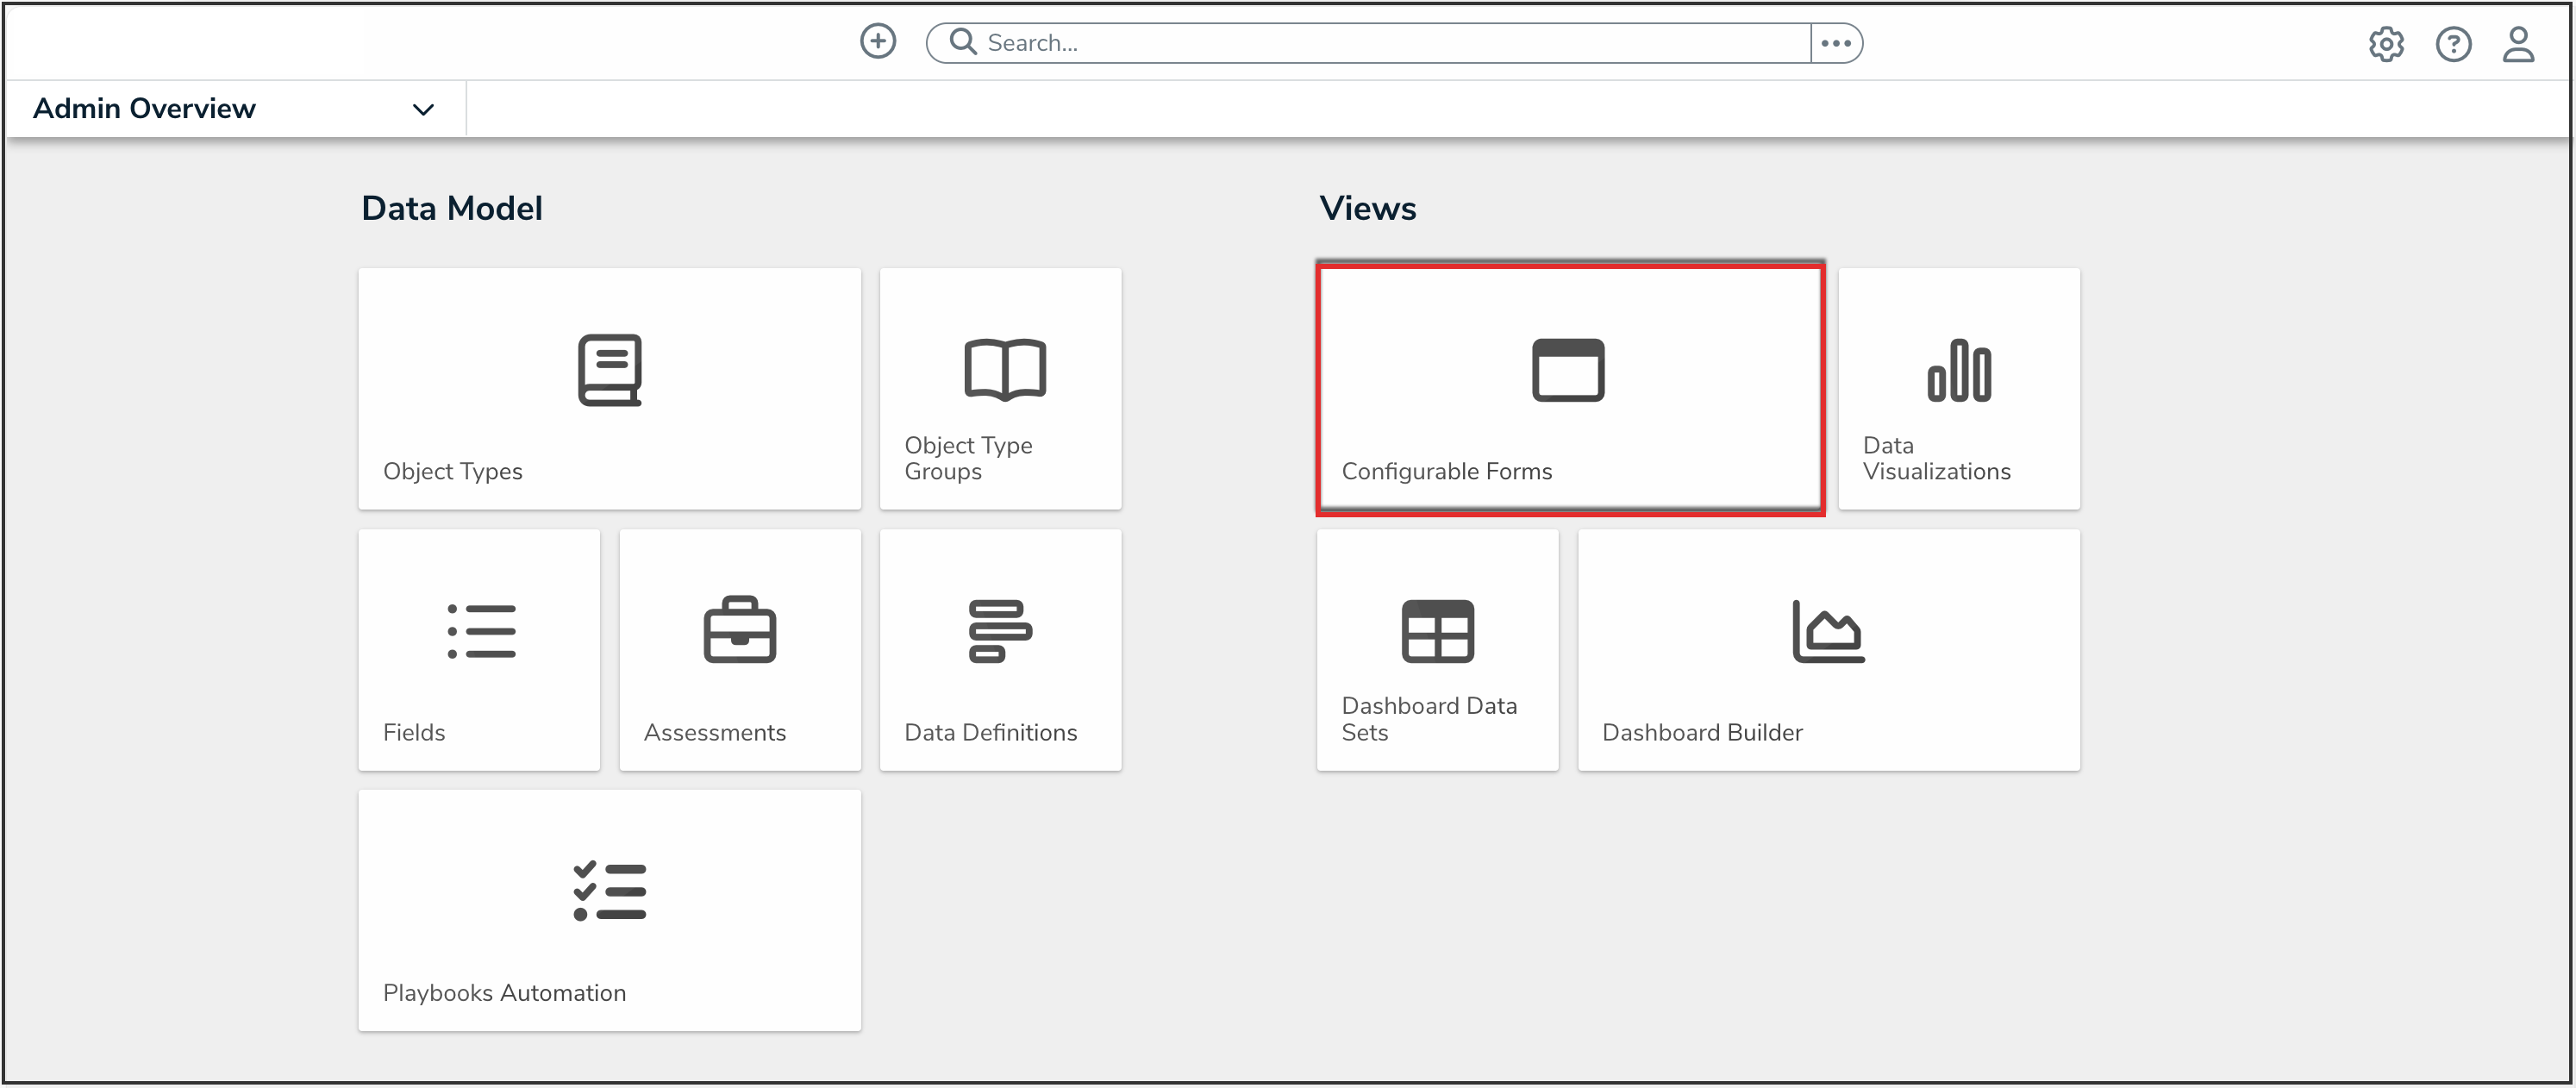
Configurable Forms Tile
- From the Configurable Forms screen, enter a form name in the Search field to narrow down the forms list.
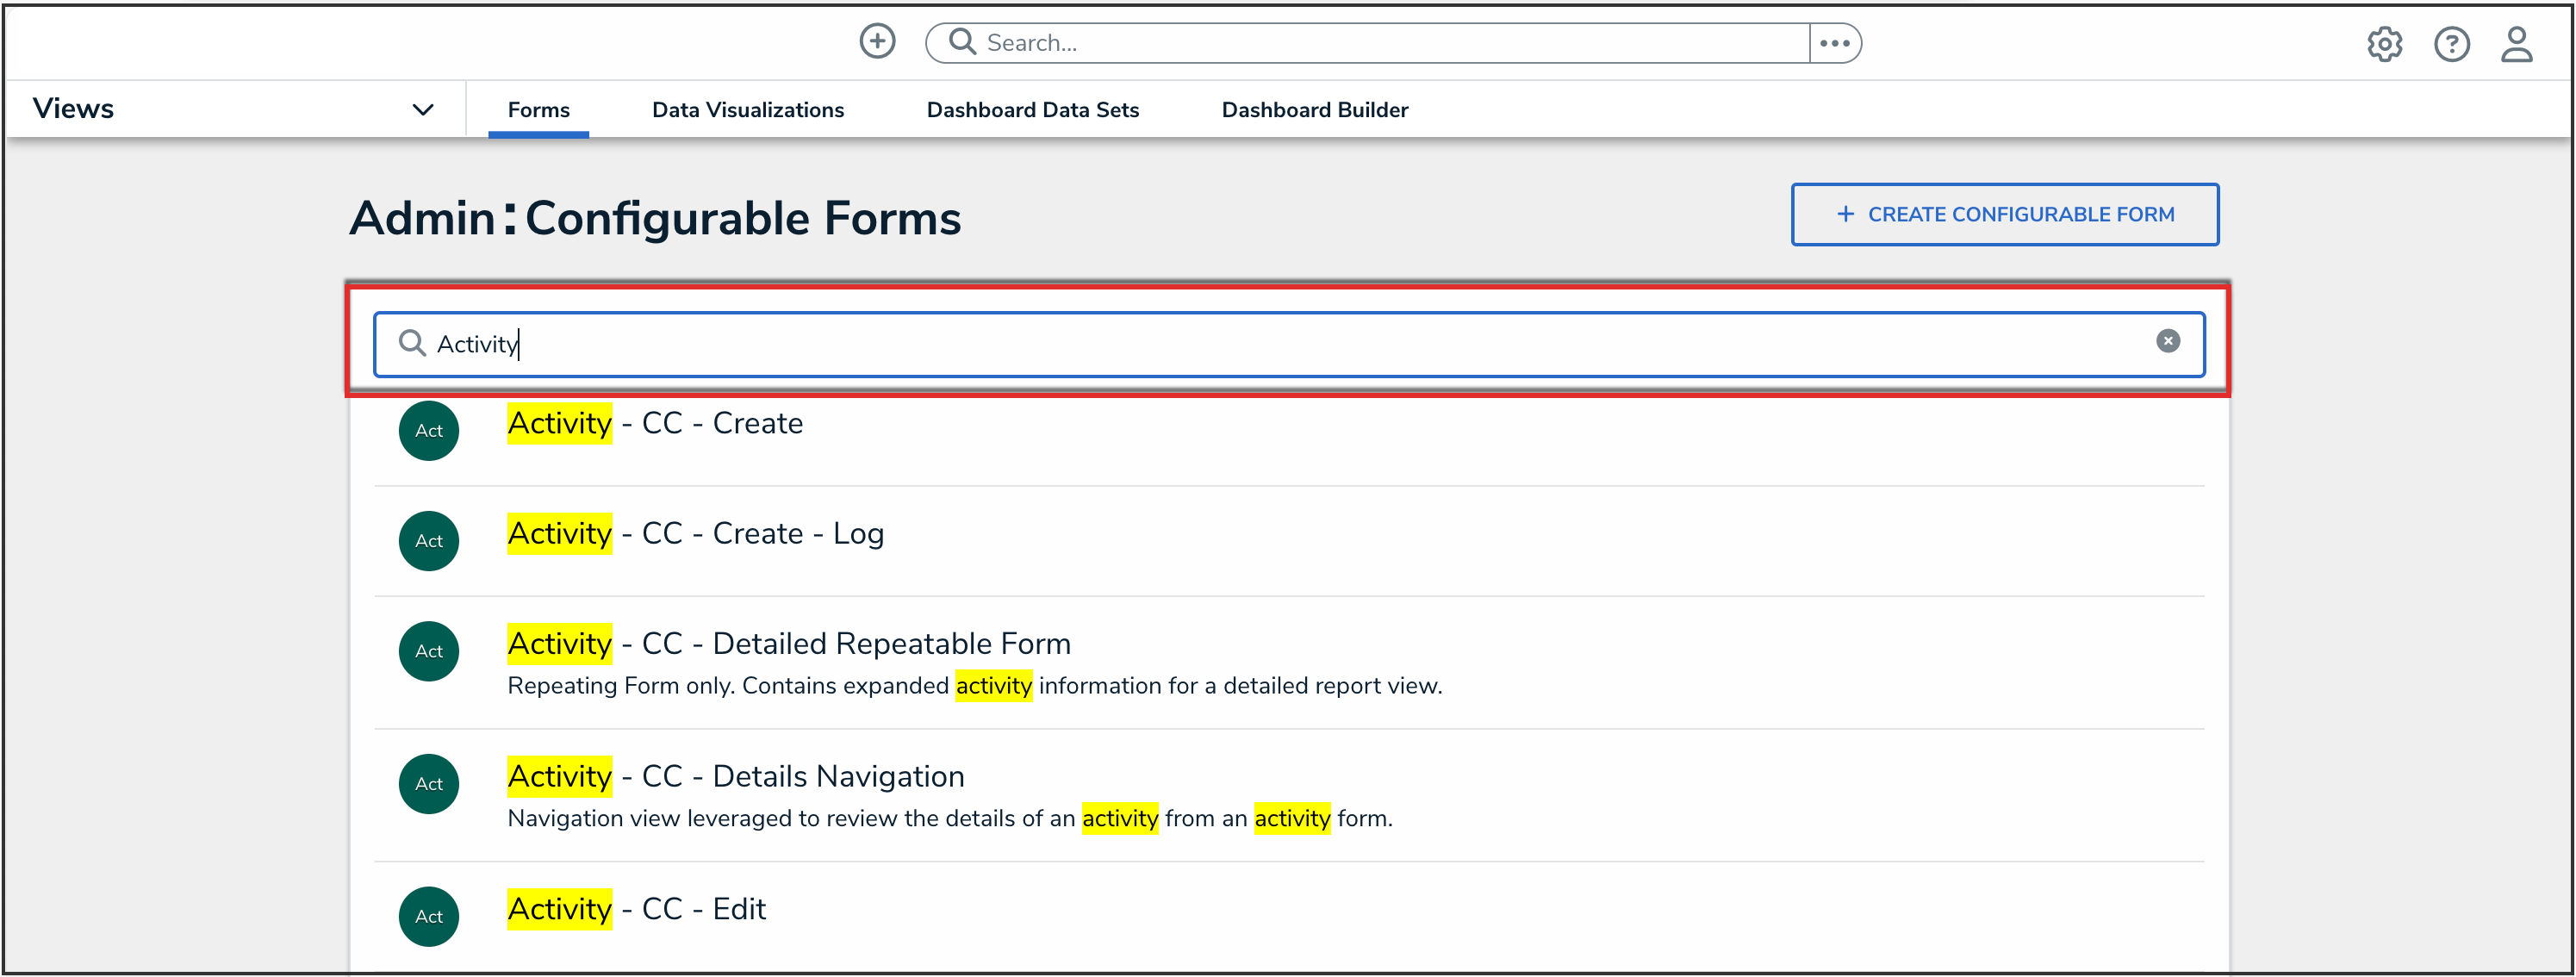
Search Field
- Click the form that you want to edit.
Configuring Formulas on Forms
- From the Admin: Edit Configurable Form screen, move the cursor over a Formula and click the Edit icon.
![]()
Edit Icon
- From the Edit Component Display pop-up, select a Display option by clicking a corresponding radio button.
- Formula Bar: A Formula Bar displays the Formula value within a color-coded bar with a label.

Formula Bar
- Formula Oval: A Formula Oval displays the Formula value with a color-coded oval with a label.

Formula Oval
- Formula Gauge: A Formula Gauge displays the Formula value on a range on a color-coded gauge with a label.

Formula Gauge
- Formula Card: A Formula Card displays the Formula value on a color-coded card with a label.

Formula Card
- Display Formula Upper Bound: The Display Formula Upper Bound toggle switch will show how the Formula value ranks against the highest value in the range (e.g., 8/25).

Display
- Click the Close button to save your changes.