Data visualizations rely on two types of data definitions: focuses and data series.
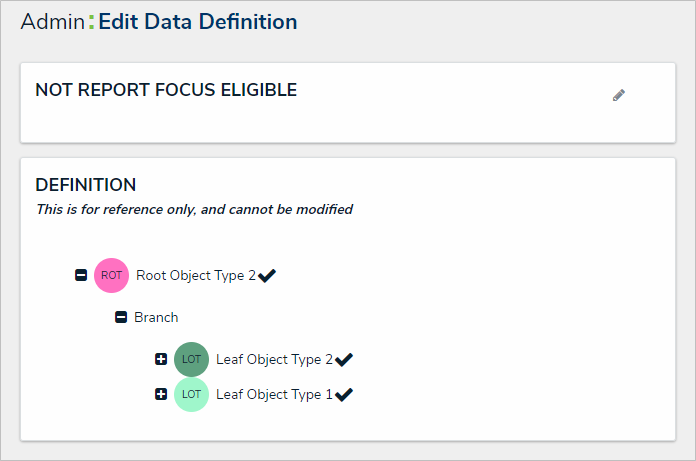
A focus is a data definition that broadly specifies which object type’s data will be displayed in a data visualization. A data definition cannot be focus eligible if more than one unique object types on the same level have been selected. More specifically, when creating a focus eligible definition, you can only select one unique leaf (object type) per each branch in the data path tree. A definition can be focus eligible with multiple selections on one leaf only if those selections are for the same object type. A focus eligible data definition. This data definition is eligible because only one leaf (object type) has been selected per each branch on the data path.
 A data definition that is not focus eligible because more than one leaf has been selected on a single branch in the data path, however, this definition may be used as a data series.
  |
Because the structure of data definition resembles a tree, the anchor object type is also known as the root, the relationships and references on the anchor are the branches, and the object types within those relationships or references are the leaves on the branches. |
When creating any new data visualization, you must select at least one existing focus eligible data definition. When creating a report or data grid, you must also select a data series definition for each report element or data grid you wish to display.
A data series is a sub-definition that’s related to the focus definition. When adding a report or data grid element you must select a data series definition that will more specifically define which object type data the element will display. The definitions you can choose from are populated based on the object type(s) selected in your focus definition. For example, if you created a report using a focus that had the Location object type as the anchor and only object type in the data path, all definitions with Location selected in their data paths, either as the anchor or leaf, will appear as options when selecting a data series. Focus eligible definitions can also be selected as data series definitions.
| EXAMPLE |
| You need to create a report that assesses the effectiveness of the risks and controls in place for each location within your company. To do this, you would first create a data definition, called “Location Only,” with Location as the anchor and sole selected object type to be the report focus. You then create an additional definition with Location object type as the anchor and the Risk and Control object types (which are connected to Location through relationships) as the leaves, naming the definition “Risks & Controls.” Now, when you create a report, you can select the Location Only definition as the Report Focus and when you add a table, chart, or heat map, you can drill down into either the Risk or Control object types by selecting the Risks & Controls definition as the data series for each report element. |


For more information on creating and viewing data definitions, see the Data Definitions section.
|
You can check if an object type is associated with data definitions on a report by going to Administration > Object Types, clicking the object type to open the Edit Object Type page then reviewing the Related Data Definitions section in the Overview tab. |