Overview
Before a report can be viewed, an administrator must create and add it to a view in an application. Some Report filters rely on the current user's time zone. Some users from different time zones may see different data in the same Report. See the Time Zone Conversions on Reports article for more information.
User Account Requirements
The data you can view in a Report depends on your role's permissions and the Report's configurations in the administrative settings.
Related Information/Setup
Please refer to the Roles Overview article for more information on role permissions.
Please refer to the Time Zone Conversions on Reports article for more information on time zones.
Please refer to the View a Data Grid and Export Object Data from a Data Analytics Report articles for information on viewing a data grid and data export Report.
Please refer to the Export a Report article for information on exporting a Report.
Please refer to the Loading & Caching Report Data article for more information on refreshing and reloading Report data.
Please refer to the Add Repeatable Forms to a Report article for more information on repeatable forms.
Navigation
- From the Home screen, click the Home dropdown menu.
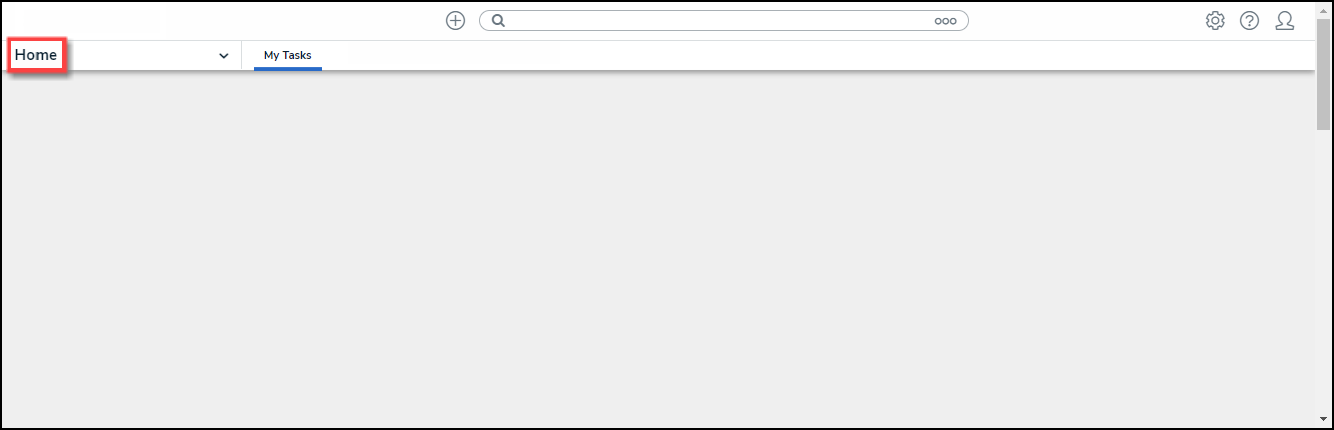
Home Dropdown Menu
- Select Reports from the dropdown menu.
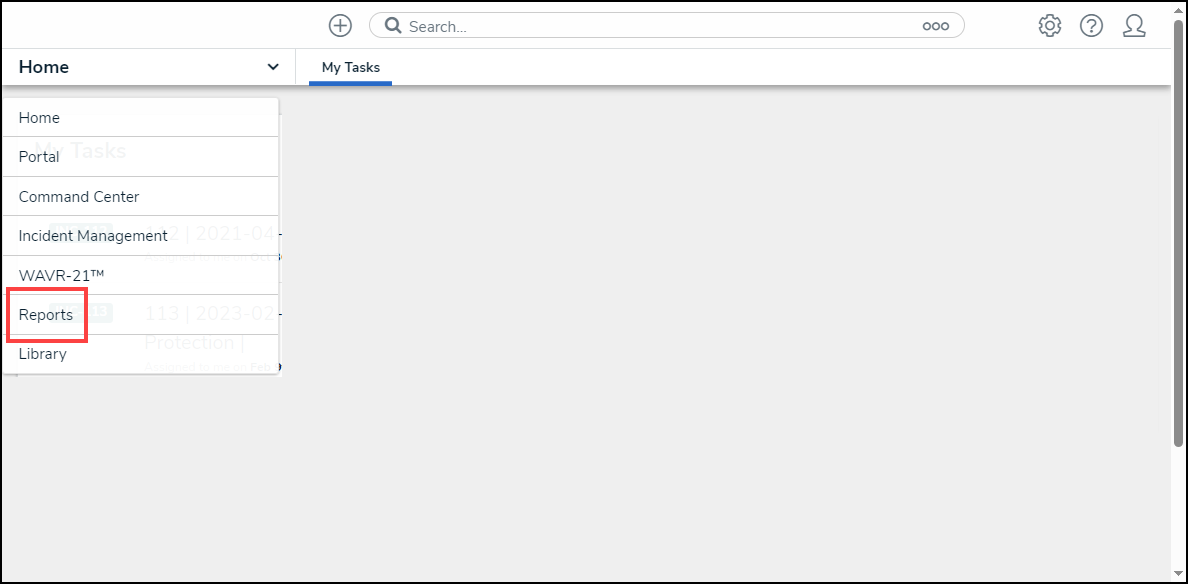
Reports
- (Optional) If your organization has multiple Applications, select an Application by clicking the corresponding tab on the Reports screen.
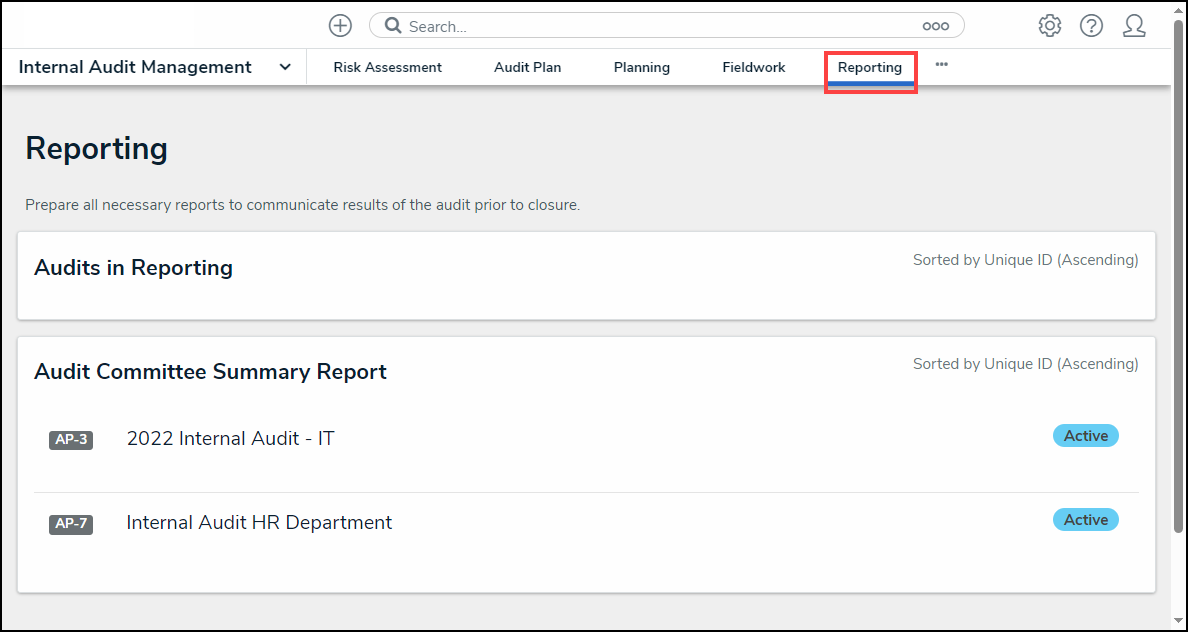
Reports Screen Application Tabs
Viewing a Report
- From the Reports screen, navigate to a Report and click the Report link.
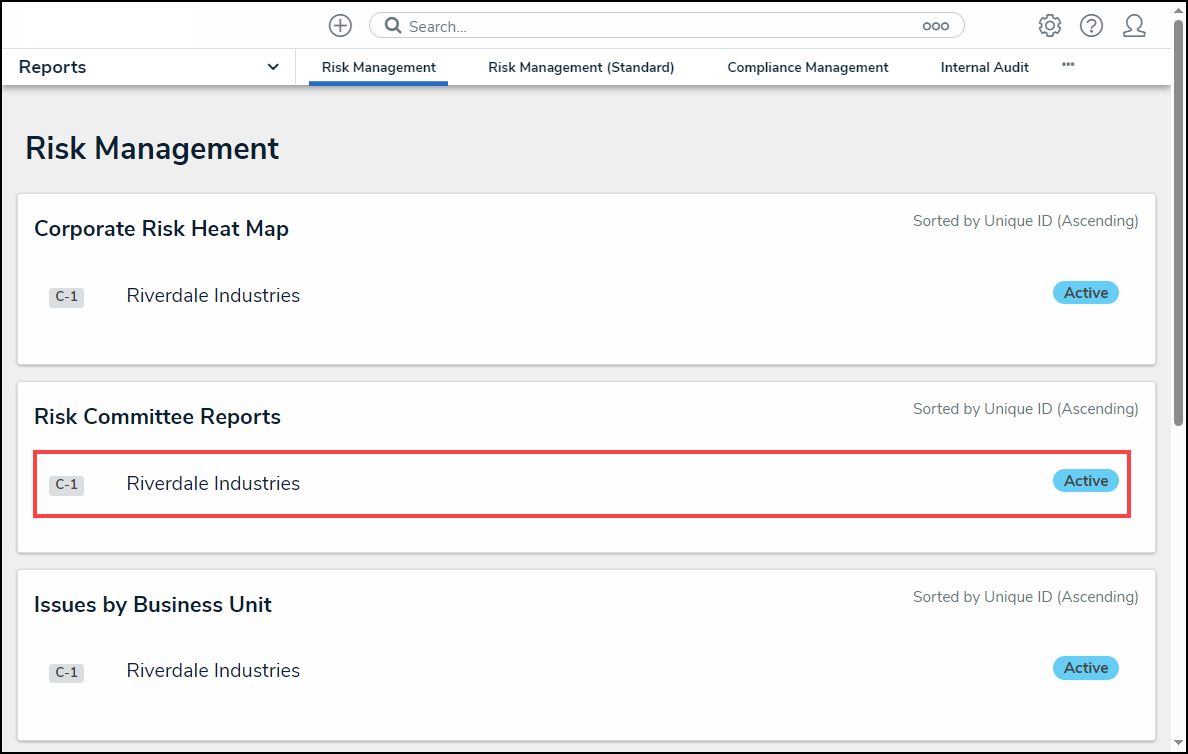
Report Link
- If a Filter is marked as Required by an Administrator during the Report creation, a Filter Report screen will appear, asking the user to fill out all required filters.
 Note:
Note:
The Run Report button will remain greyed out until all required fields are filled out.
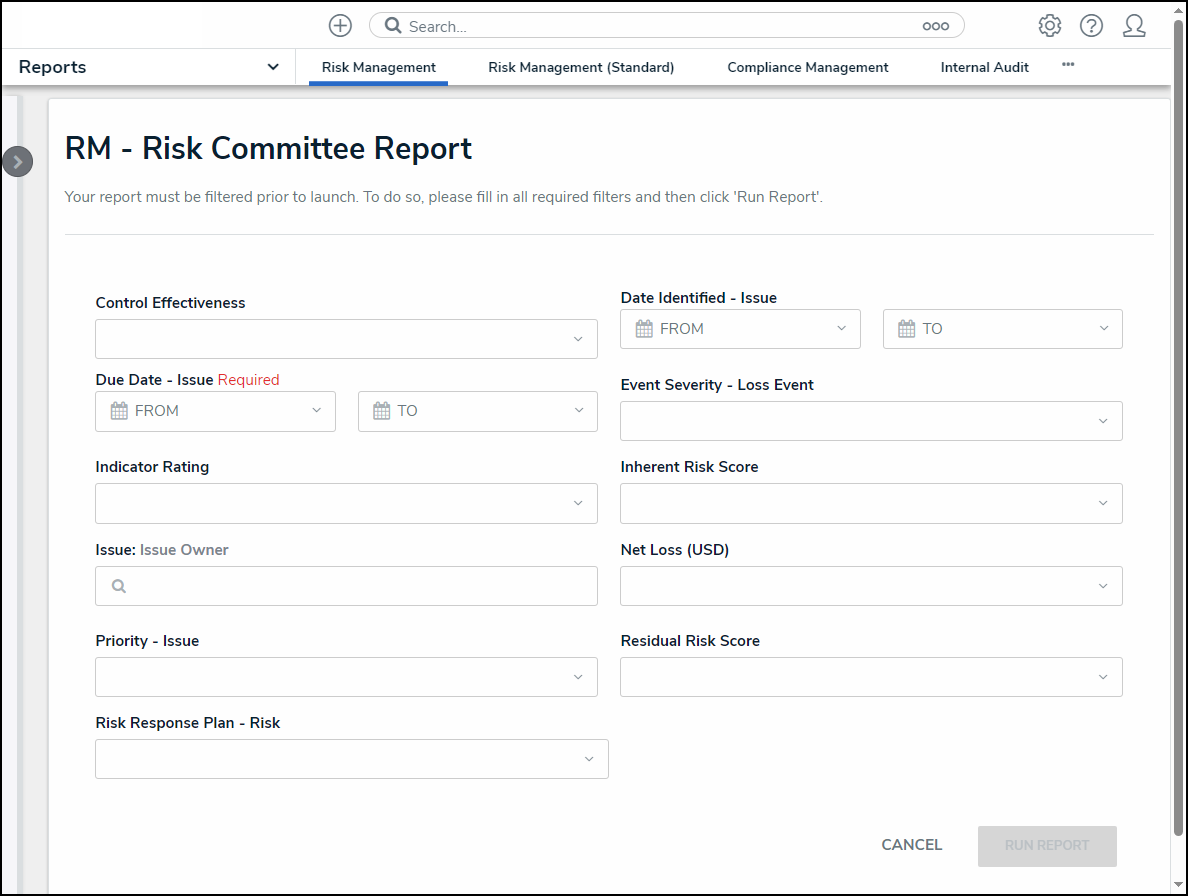
Filter Report Screen
- Fill out all required filters and click the Run Report button to generate the Report.
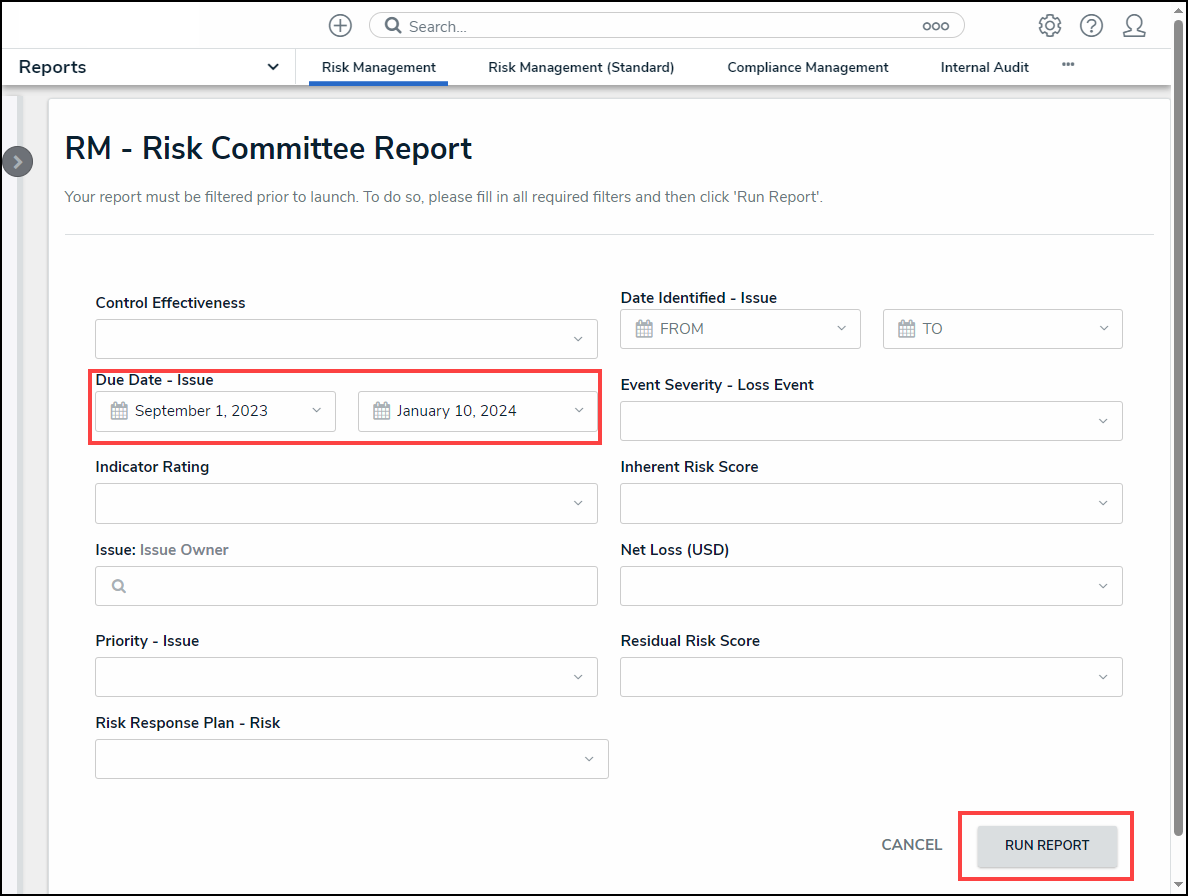
Run Report Button
 Note:
Note:
If an administrator configures, filters can also be applied after loading the Report. See the Filters section below for more information.
- If the Report includes a bar, column, or pie chart, hover your cursor over the chart for more information about the data.
 Tip:
Tip:
If using a keyboard to navigate, press the Tab key to select a chart or legend and use the Arrow keys to navigate between chart or legend segments or items.
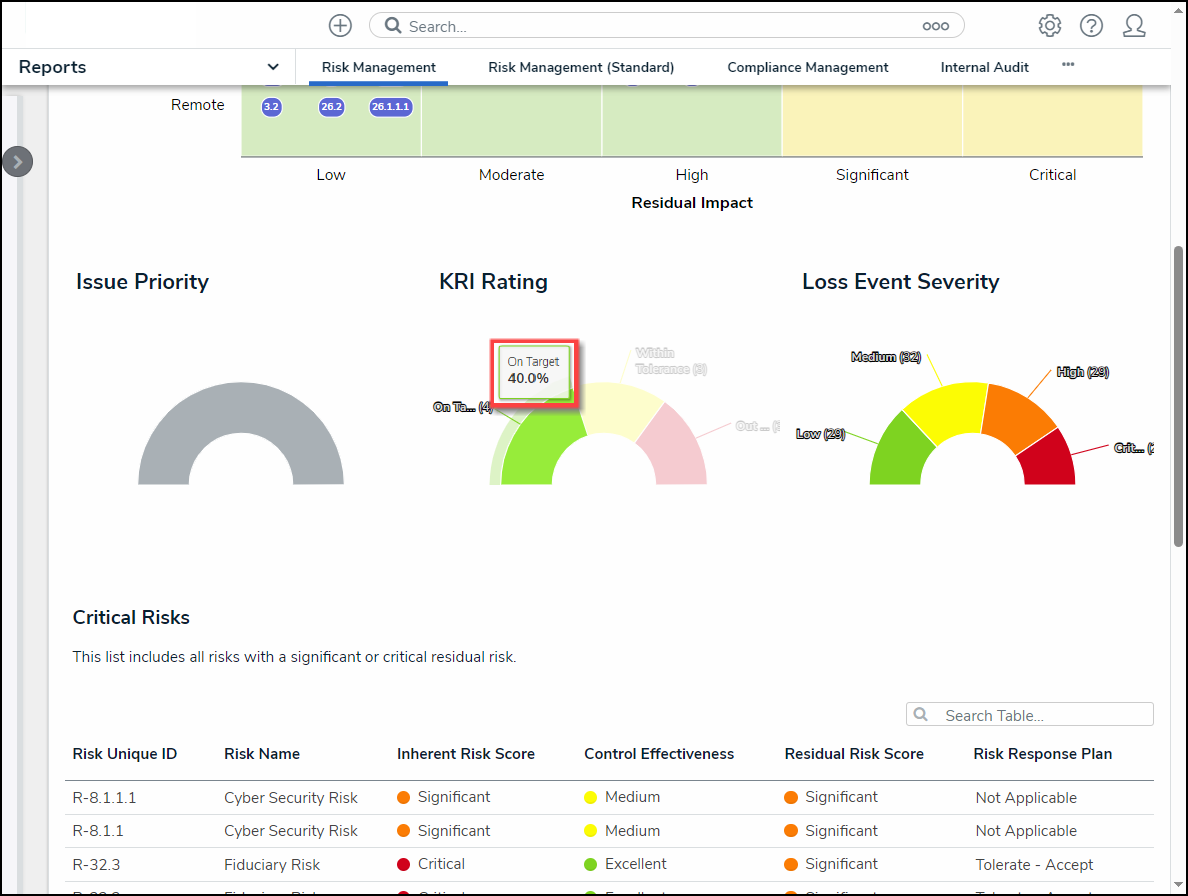
Chart Hover Over
- Clicking on a pie chart section will separate it from the rest of the chart for emphasis.
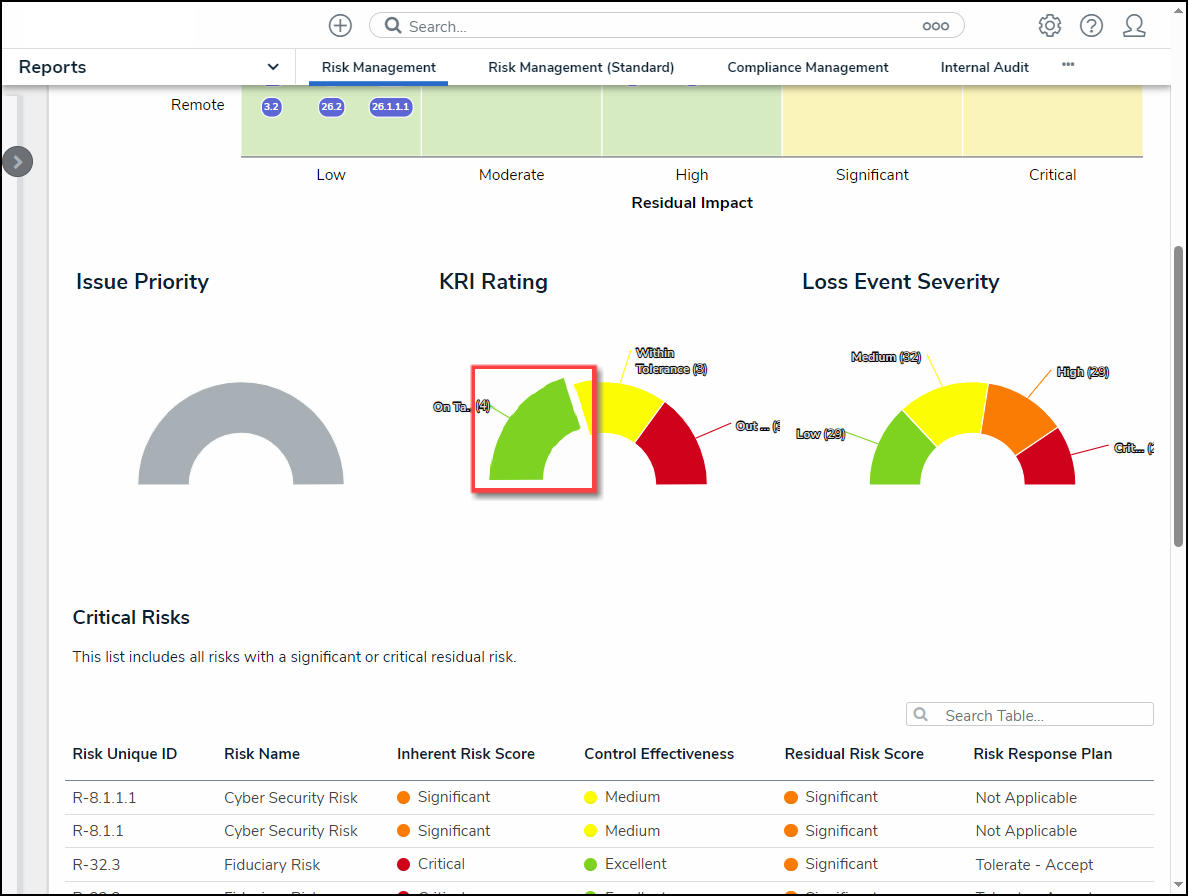
Chart Highlight
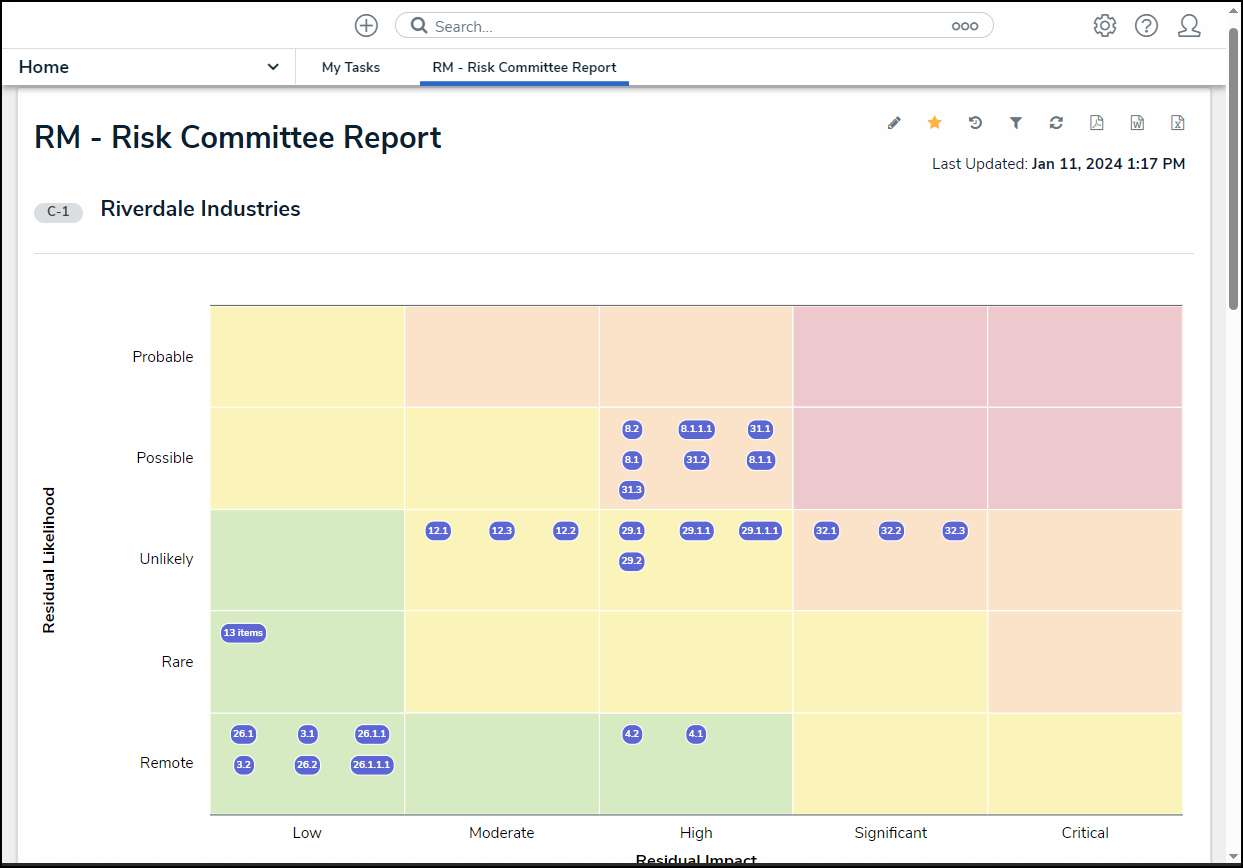
- If the report includes a heat map, hover your cursor over the objects on the heat map (circle and unique IDs) to display the object's description.
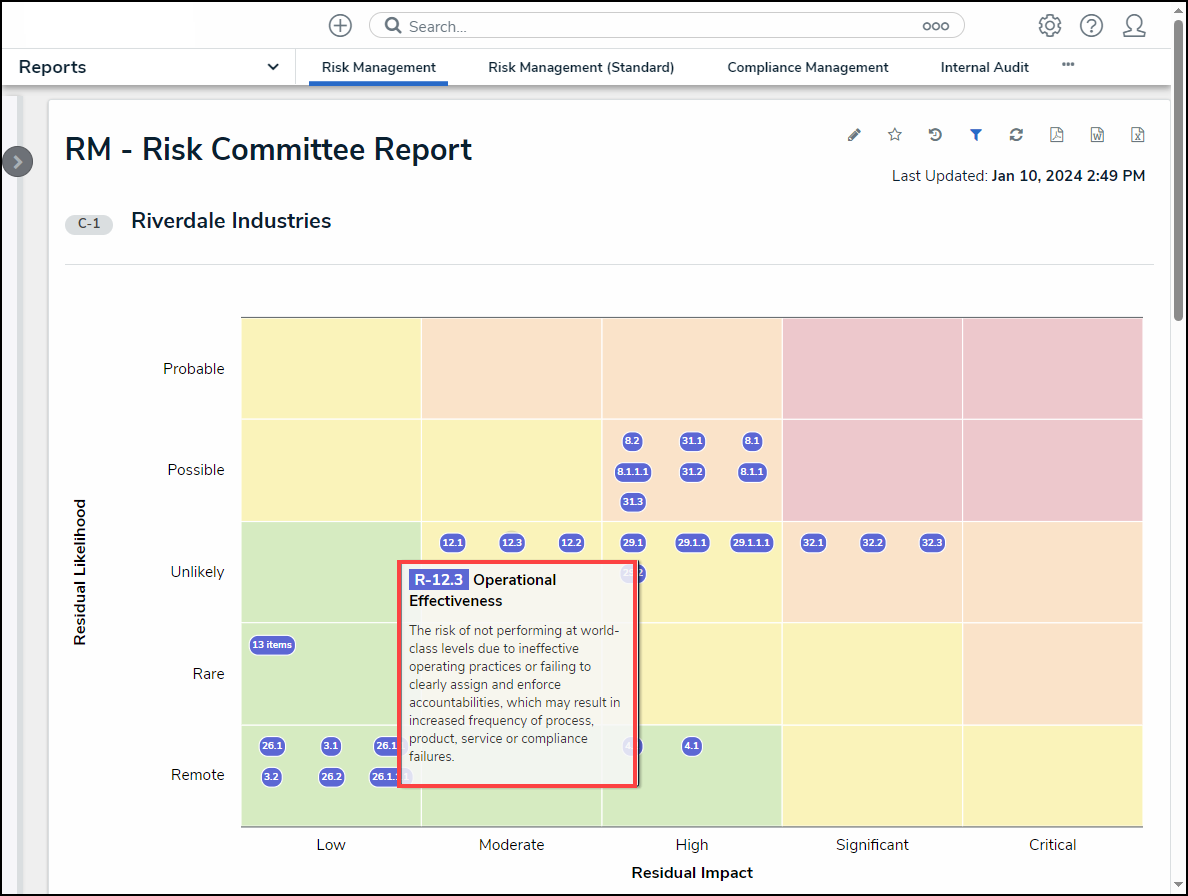
Heat Map Object Description
- Click an object (circle and unique IDs) for more detailed information.
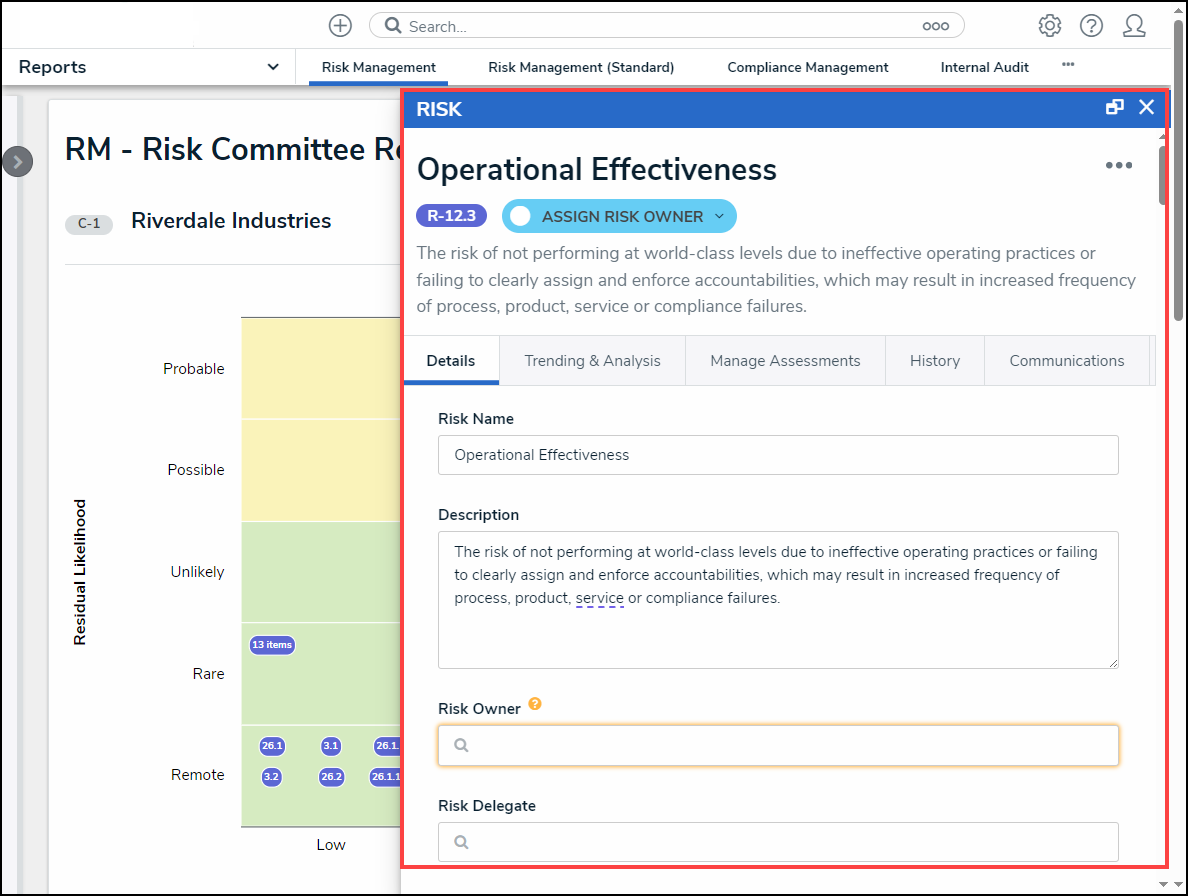
More Detail
- If the report includes a table, click a cell to open the associated object in a pop-up screen for further details.
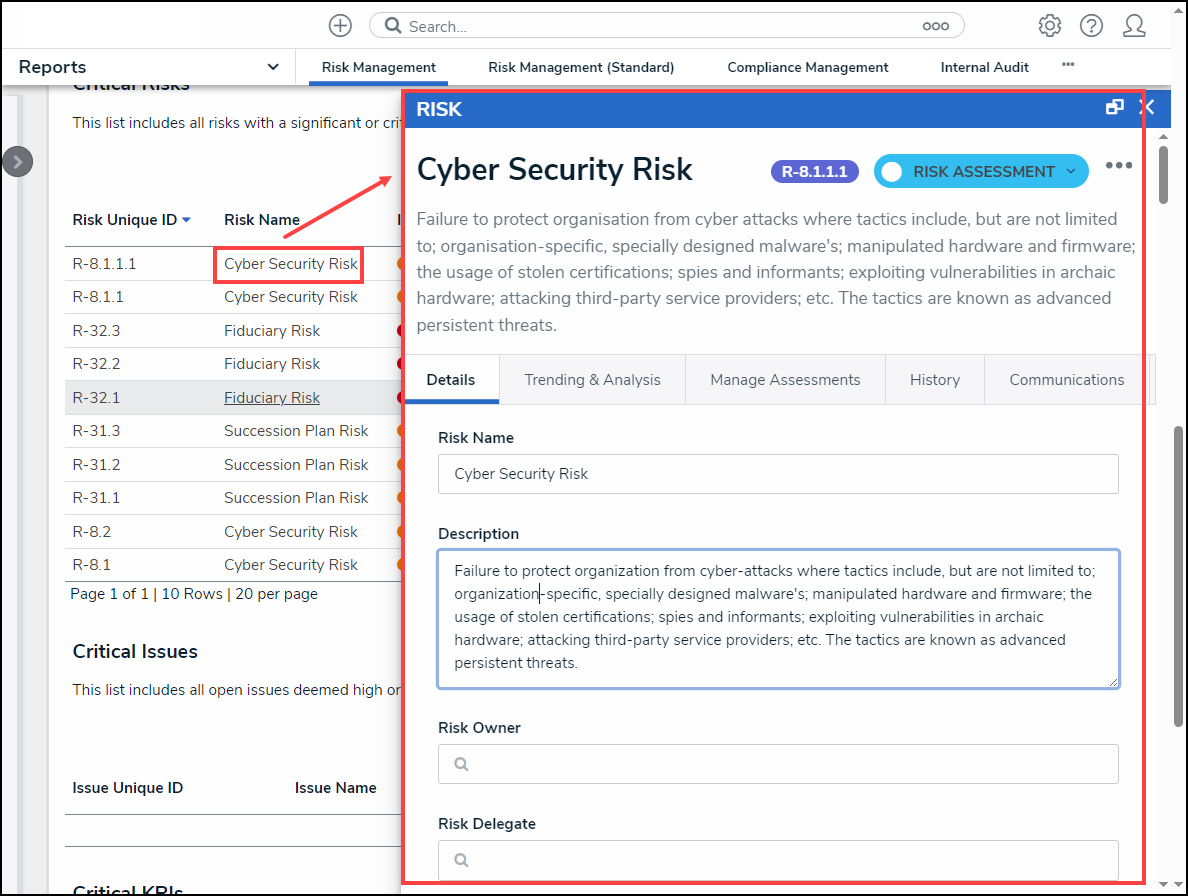
Object Pop-up Screen
- Click a Column Header to sort the table by ascending (arrow icon up) or descending (arrow icon down) order based on the column's value.
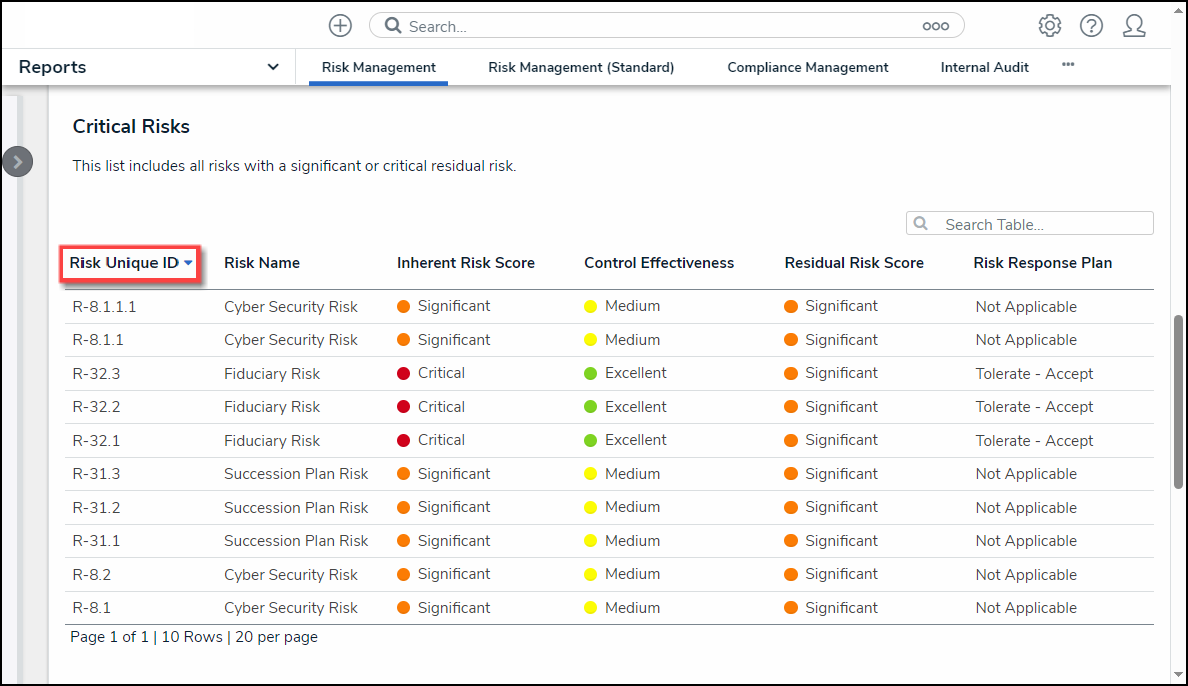
Sort by Column
- Click the Next and Previous icons to scroll through additional table pages if the table has multiple pages.
- Click the Search icon and enter a keyword to narrow the data results listed within the table.
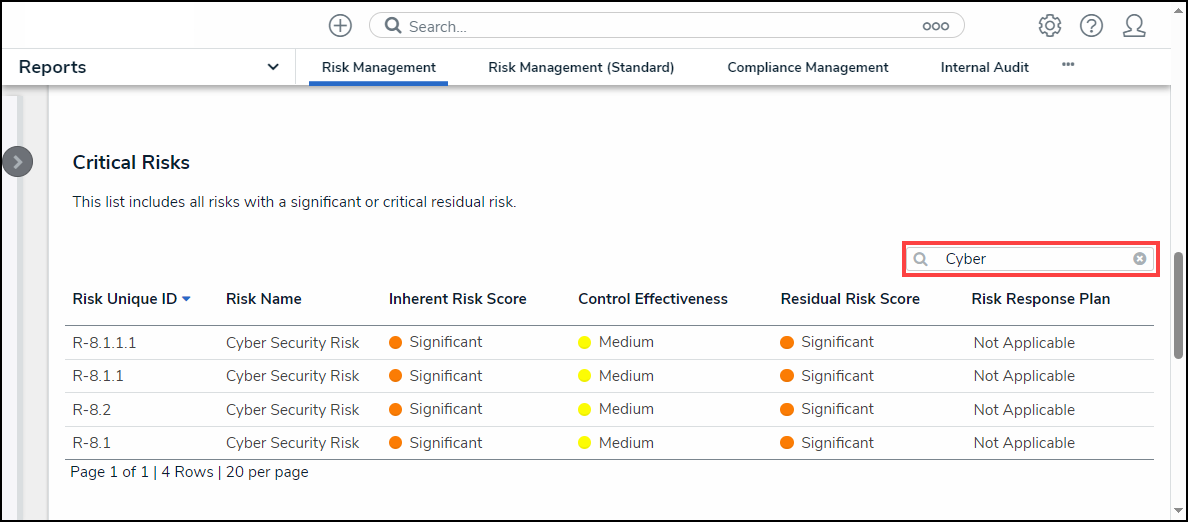
Search Field
- Click the Refresh icon in the Toolbar at the top of the screen to refresh the report data. Please refer to the Loading & Caching Report Data article for more information on refreshing and reloading report data.
![]()
Refresh Icon
Starred Reports
- Click the Star icon in the Toolbar at the top of the screen.
![]()
Star Icon
- From the Add Report to Home screen, click the Label Report field to enter a custom report label or leave the field alone to use the default label.
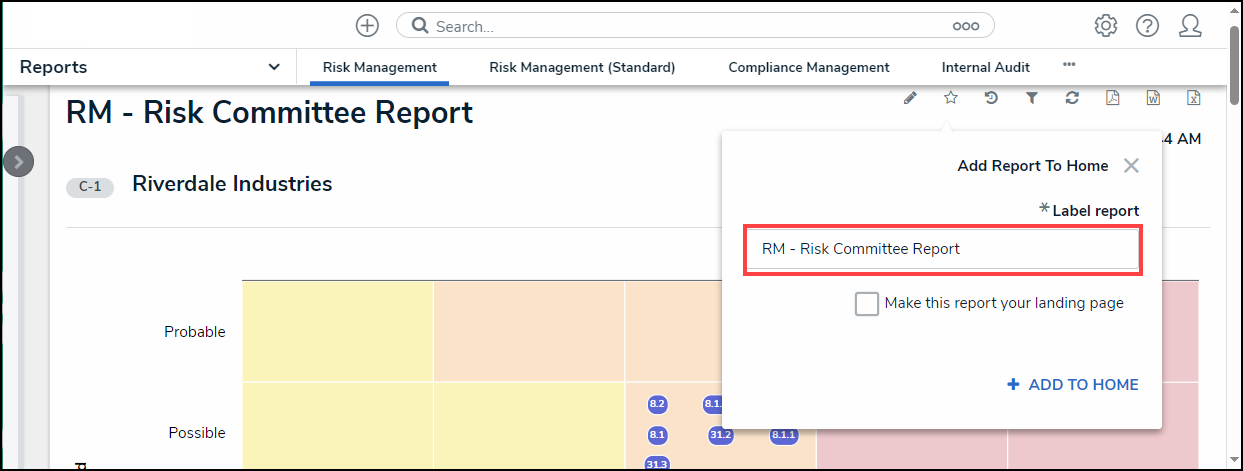
Add Report to Home Screen
- Click the Make this report your landing page checkbox to have the report open when you first log in, replacing the Home screen.
Report Home Screen
- Click the + Add to Home link to add the report to your My Task list or to add the report as the new Home screen.
- Click the highlighted Star icon.
![]()
Highlighted Star Icon
- From the + Add to Home screen, click the Remove from Home button to remove the report from the Home screen.
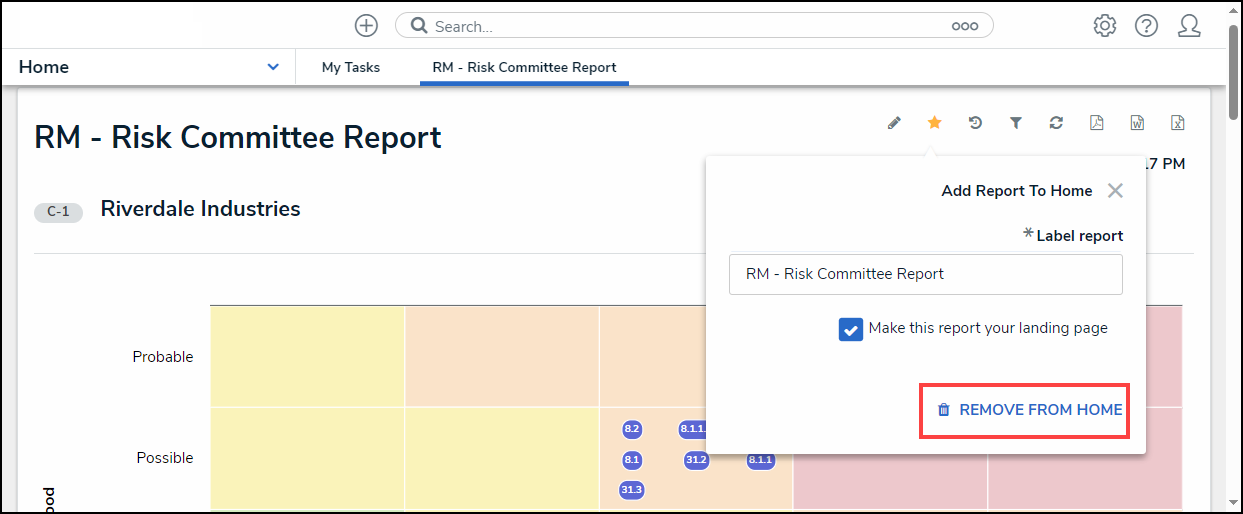
Remove from Home button
Historical Data (Point in Time Reporting)
- Click the Historical Data icon in the Toolbar at the top of the screen.
![]()
Historical Data Icon
 Note:
Note:
If Point in Time Reporting has not been enabled for this report, the Historical Data icon will not be visible.
- From the Point in Time Reporting screen, click the Report Date field and select a report date from the Calendar pop-up.
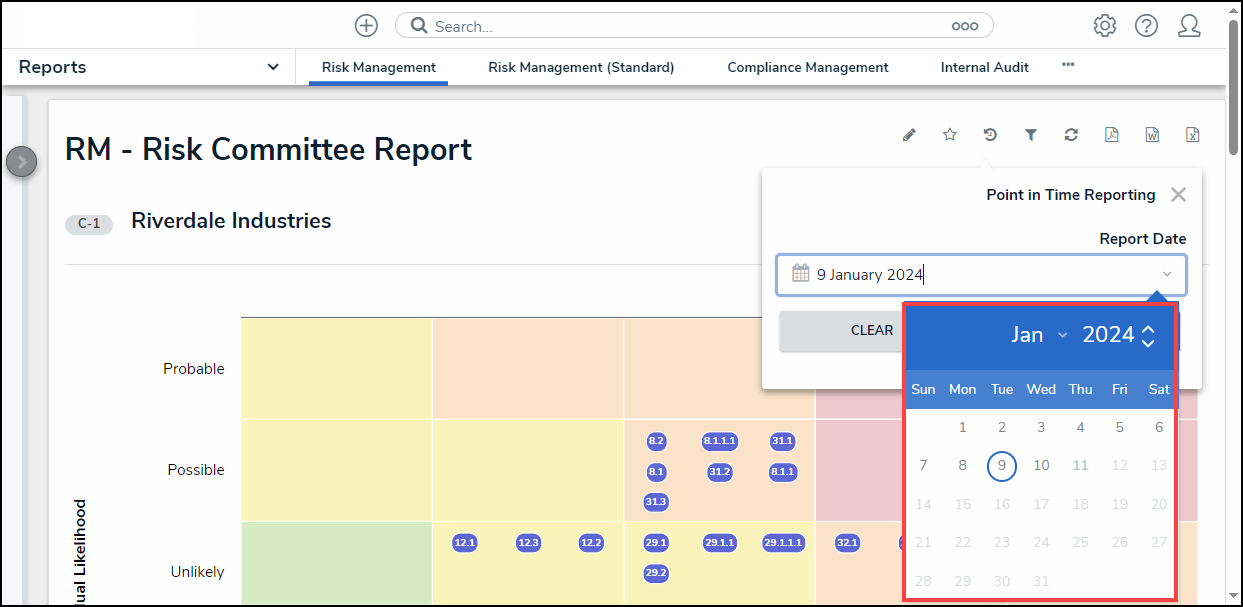
Calendar Pop-up
- Click the Apply button to refresh the report with the historical data based on the Date selected from the Calendar pop-up.
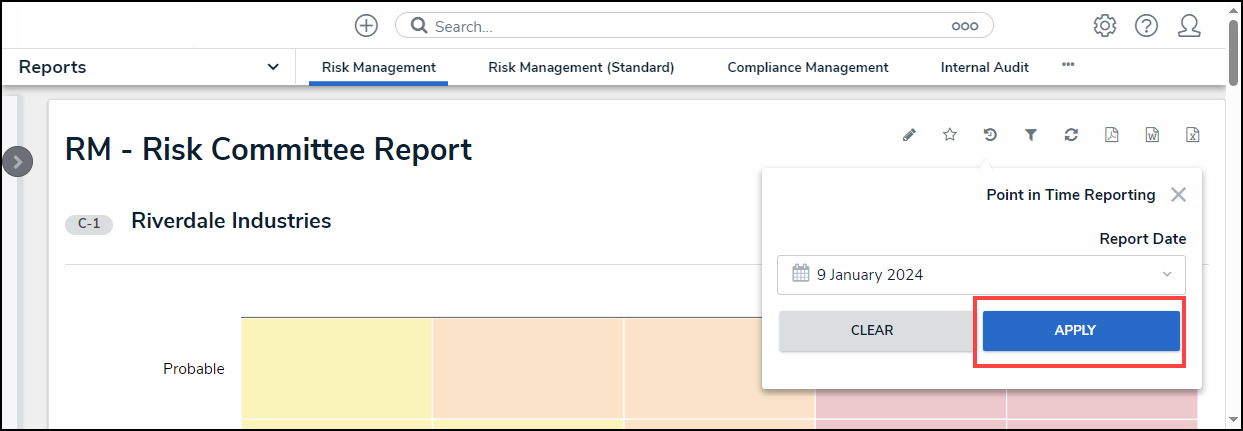
Apply Button
Filters
The Filters icon will appear if configured by an Administrator.
- Click the Filter icon in the Toolbar at the top of the screen.
![]()
Filter Icon
- From the Filter pop-up, apply any of the following filters to narrow the data that appears on the report:
- State: Allows users to filter the table data by object workflow states (e.g., Creation, Draft, Active, and Archived).
- Role: Allows users to filter the table data by user roles granted direct access to objects from the report's data definition.
- Date & Time: Allows users to filter the table data by date and time values. If the field is configured to collect the date and time, the report is filtered based on the current user's time zone.
- Select List: Allows a user to filter table data by select list values (e.g., Low, Medium, High).
- Formula: Allows a user to filter table data by formula labels.
- Relationship/Reference: Allows a user to filter table data by one or more object type relationship or references. For example, selecting the Risk 1 object type in this filter will also display all the Control objects that Risk 1 appears on through a relationship.
- Object Type: Allow a user to filter table data by object type.
 Note:
Note:
Sections may be blank if these filter types have not been added to the report by an administrator.
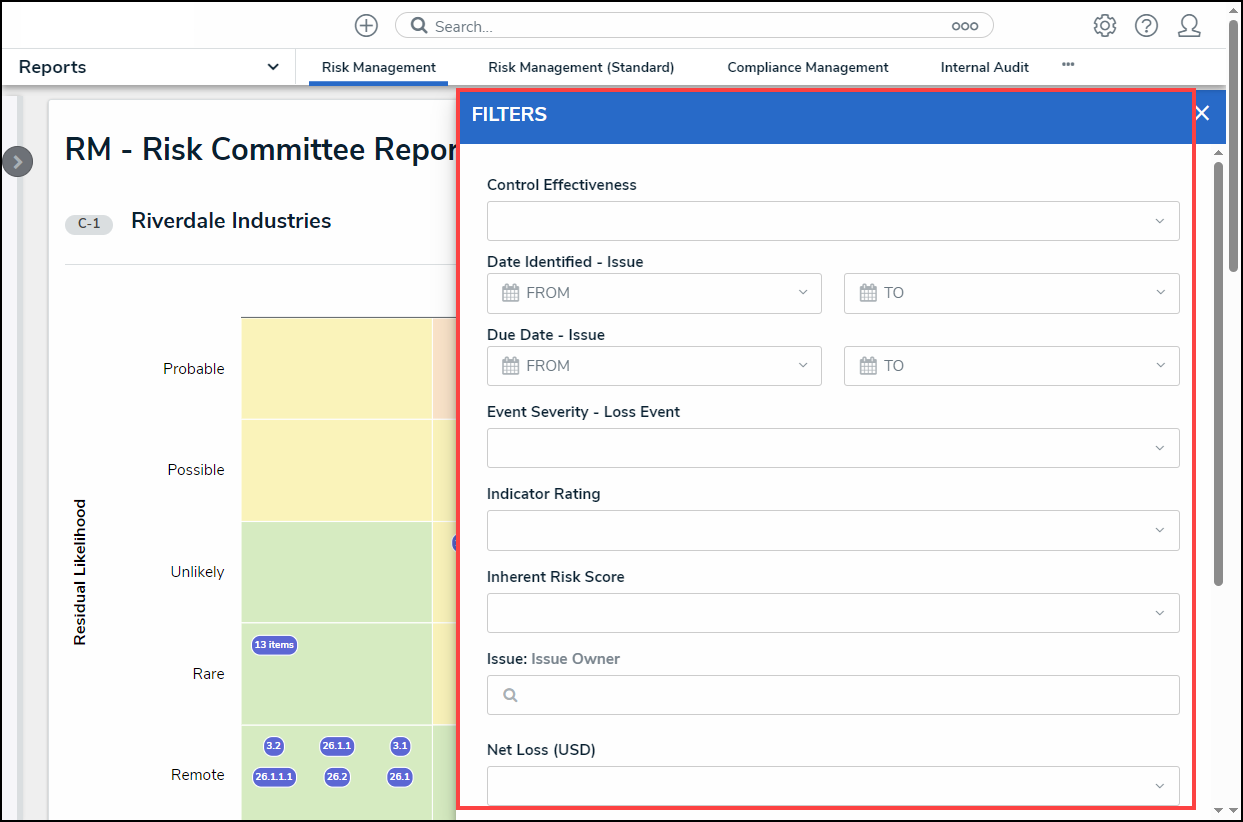
Filter Pop-up
- Click the Apply Filter button to apply any selected filters to the table data.
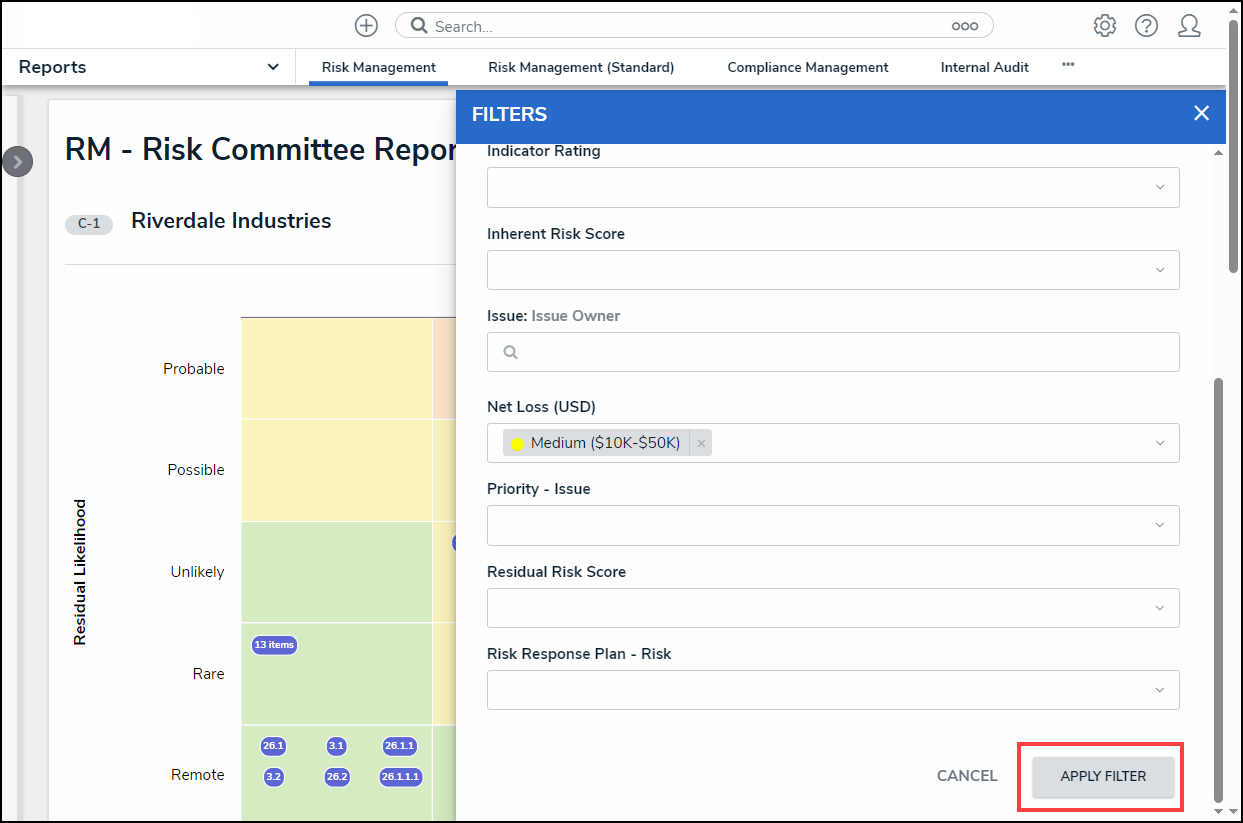
Apply Filter Button
- The Filter icon will appear blue, indicating that there are filters applied to the table data.
![]()
Filter Icon
- Click the x beside a filter to remove the filter. If the filter is date-based, select the field and use the Delete or Backspace key to delete the dates from the fields.
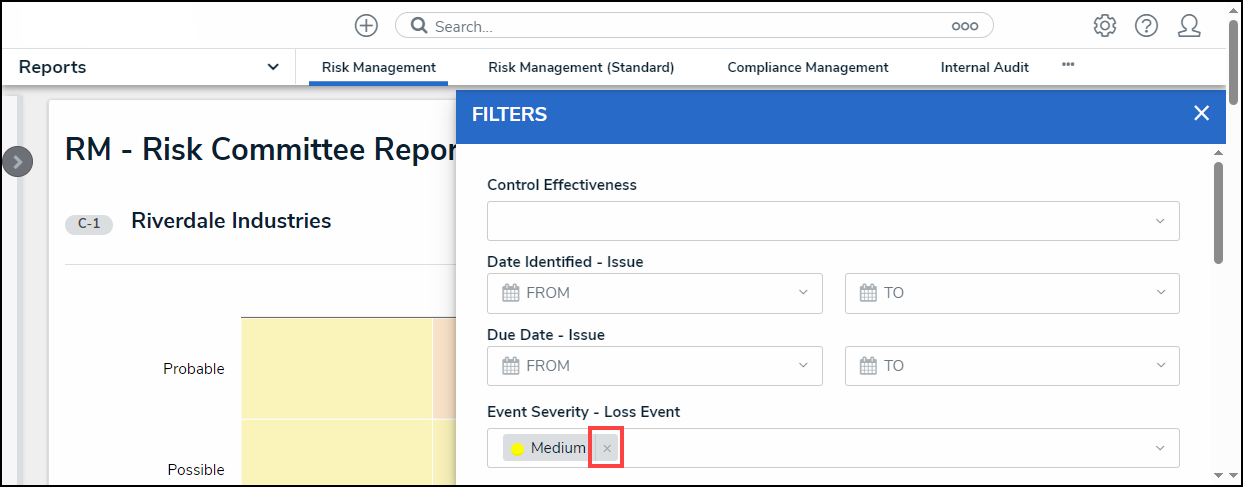
Removing a Filter
- Click Apply Filter to save your changes.