The Open a data visualization action element allows end users to open a data visualization directly from an object instead of through a view. For example, if this action was added to a standard form for the Location object type and a user was working in a location object, they could click the "View Incidents at this Location" action button to view a report that outlines details about the incidents that occurred in that city. Clicking on a data visualization action on an existing object will display a related data visualization. In this case, clicking View Incidents at This Location will display the Incidents by Location Report with the Toronto object as its focus.
To add the Open a Report action to a standard form:
- If the form is not already open, click the
 icon in the top bar > Configurable Forms in the Views section, then select a form.
 - Click the
 icon in the Actions section of the Form Elements palette to expand it.
 - Drag and drop the Open a data visualization element to the canvas, which will automatically display the Add Component screen.
The Open a data visualization form action should only be added to forms for existing object types. See Form Actions Overview page for more information. - Enter text to display on the clickable button in the Button Text field.
- Select a data visualization from the Data Visualization dropdown menu. You can only select visualizations that are related to the current configurable form's object type.
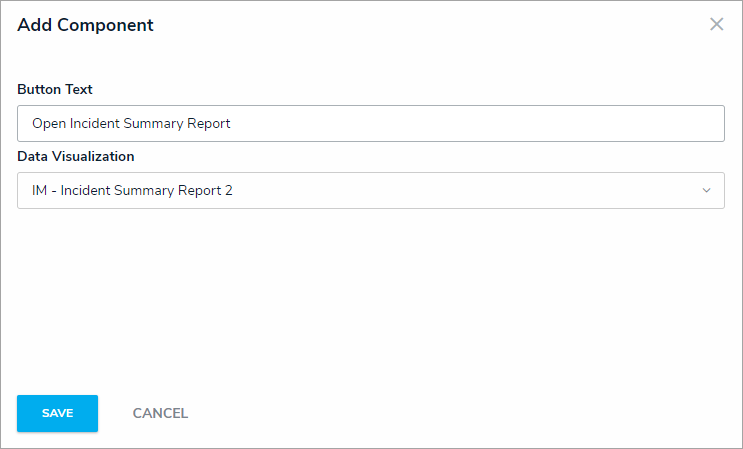 The Add Component window.
 - Click Save to return to the canvas.
- To edit the action, hover your cursor over the element on the canvas, then click the
 icon.
icon.
 icon in the top bar > Configurable Forms in the Views section, then select a form.
 icon in the Actions section of the Form Elements palette to expand it.

 icon.
icon.