In Resolver Core, reporting visibility is restricted by user group. In Security Risk Management (SRM), reports can only be viewed by members of the Security Risk Team, Security Assessment Team, and SRM Assigned Actions user groups.
How these different user groups work with reports (i.e., data visualizations) varies, depending on the unique insights they seek. This article covers the diverse ways SRM users may interact with their reporting data (e.g., pie charts, data grids) in their application.
To view a report:
Log into a user account from the Security Risk Team, Security Assessment Team, or SRM Assigned Actions user groups.
- Click the dropdown in the nav bar > Security Risk Management.
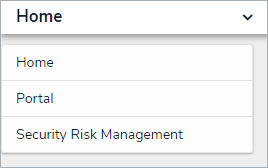 The Security Risk Management app in the nav bar.
 - Navigate to the Reporting tab and click the relevant report to open it.
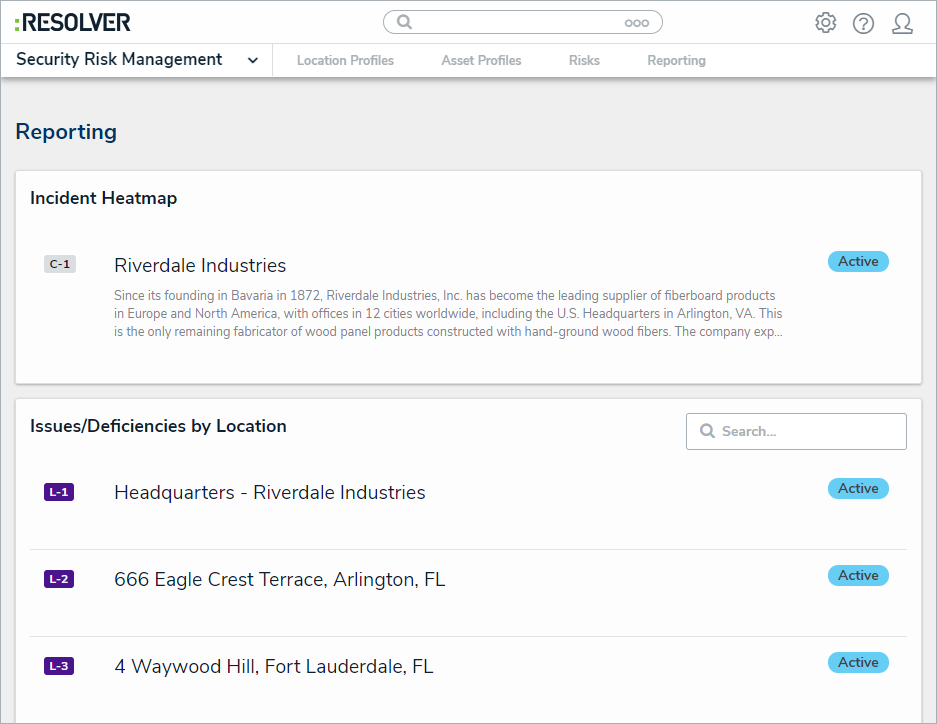 The Reporting tab of Security Risk Management.


To view a bar, column, or pie chart:
- Hover your cursor over the chart for more detailed information.
- Click on a pie chart section to make it more prominent on-screen.
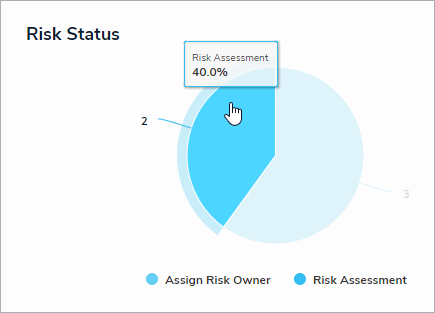 Hover the cursor over a bar, column, or bar chart for more details.
To view a table:
- Click a cell to open the associated object in a palette.
- Click a column to sort the data in the table.
- Click Next or Previous at the bottom of the table to scroll to any other pages.
- Enter search terms in the Search Table... field to narrow down which data displays.
- Click the
 icon to export the table data into a Word document.
 - Click the
 icon to export the table data into an Excel spreadsheet.
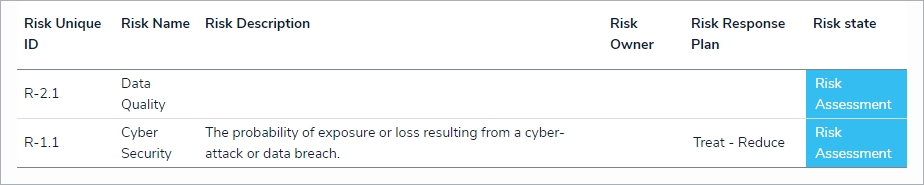 Click a cell to open a palette or click a column header to sort the table’s data.
 | Only table data can be exported into a Word document or Excel spreadsheet. If you export data from a report that also contains a chart or heat map, that data will not appear in the document or spreadsheet. |
To view a data grid:
- Hover your cursor over a Name column cell, then click the
 icon to open a grid object in a palette.
 The palette icon in the Name column.
- Click a cell, then type your changes, or select from the available edit options.

If the column is not marked as Read-Only, changes made to cells are applied to the relevant object and saved automatically.
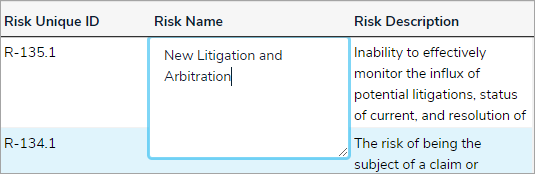 Click to edit cell (unless marked as Read-Only).


- Hover your cursor over the top of the column to show the
 icon, then click and drag to resize the column.
 - Click the column name at the top of the grid to sort the data alphabetically in ascending order.
- Click the column name again to sort the data in descending order.
- Click the column name a third time to remove any sorting.
- Click a cell with Rich Text Formatting enabled to open the RTF editor, type your changes, then click the
 icon to save.
| If you don't have permission to edit the RTF field, clicking it will display the fields' contents in focused mode. Click x to close the RTF editor or window and return to the data grid. |
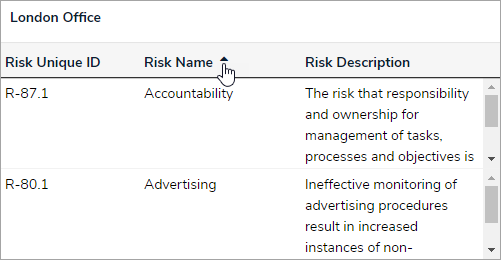 Sorting the columns on a grid.

- Click the < or > icons to move the current page forward or back by one. Alternatively, click the textbox and type the relevant page number, or click the page number arrows, then click away from the text box to reload.
- Adjust the number of rows displayed by selecting an option from the row dropdown menu.
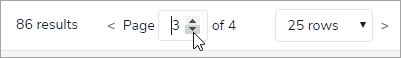 Changing the grid page.

- Click the
 icon in the top-right corner of the page.
 - To show/hide columns, select/deselect the column checkboxes.
- Select the Wrap Cells/Overflow Cells options to wrap/unwrap the data.
- Select the Display colored cells as ovals checkbox to show formula or select list cells as text in that format (instead of with a full background color). This option does not apply to workflow states.
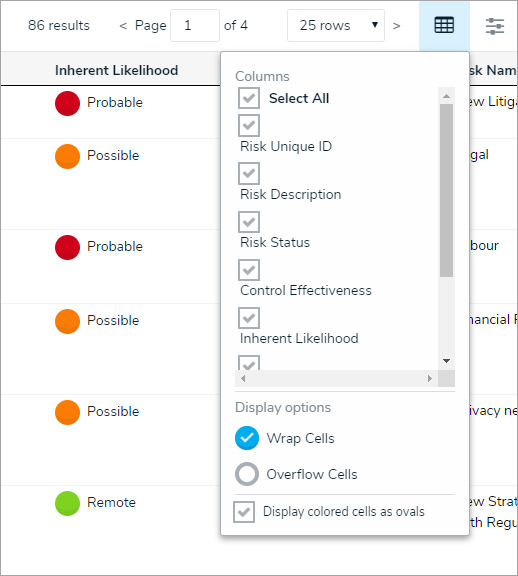 Grid display options.
 - Click the
 icon to the page’s far right to enable filters below the column headers, then begin typing keywords or select an option.
 - Click the
 icon again to disable/reset any filters.
 - Refresh your browser to reset any custom display settings, including filters, column widths, hidden columns, page numbers, or rows.
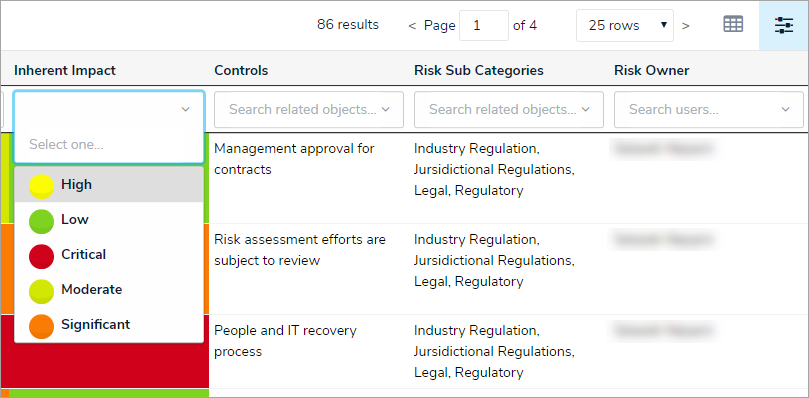 Filtering how the data grid displays.


To star a report:
- Click the
 icon at the top-right corner of the report to open the Add Report To Home window and create a report tab in the nav bar.
 - Enter a custom tab name in the Label report field. The report's name, as saved by an administrator, appears in this field by default.
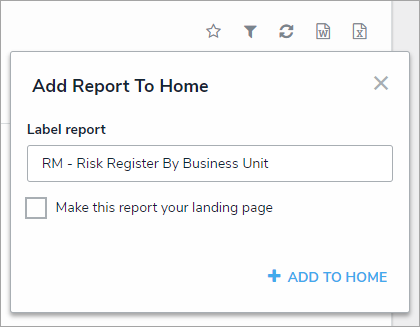 The Add Report To Home window.
 - Select the Make this report your landing page checkbox if you want this report to replace the My Tasks tab or another report tab on your screen.
- Revert back the home page back to My Tasks by deselecting the checkbox.
- Click Add To Home to finish.
- Delete the tab from the nav bar by clicking the
 icon, then click Remove From Home.

To view Point in Time Data:
- Click the
 icon at the report’s top-right corner to open the Point in Time Reporting window. When a report has filters applied, the point in time icon will appear in blue (
 ).
). - Click the Report Date field to select the relevant date and click Apply.
- To return the report to its default state, click the
 icon and click Clear.
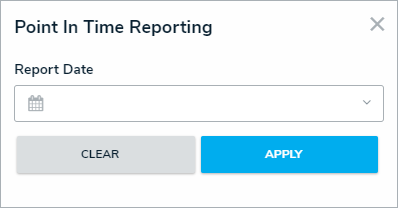 The Point in Time reporting window.
To apply Filters to a report:
- If filters are configured, click the
 icon at the report’s top-right corner to open the Filters palette. When a report is displayed with filters applied, the filter icon will appear in blue (
 ).
). - Complete the fields as needed.
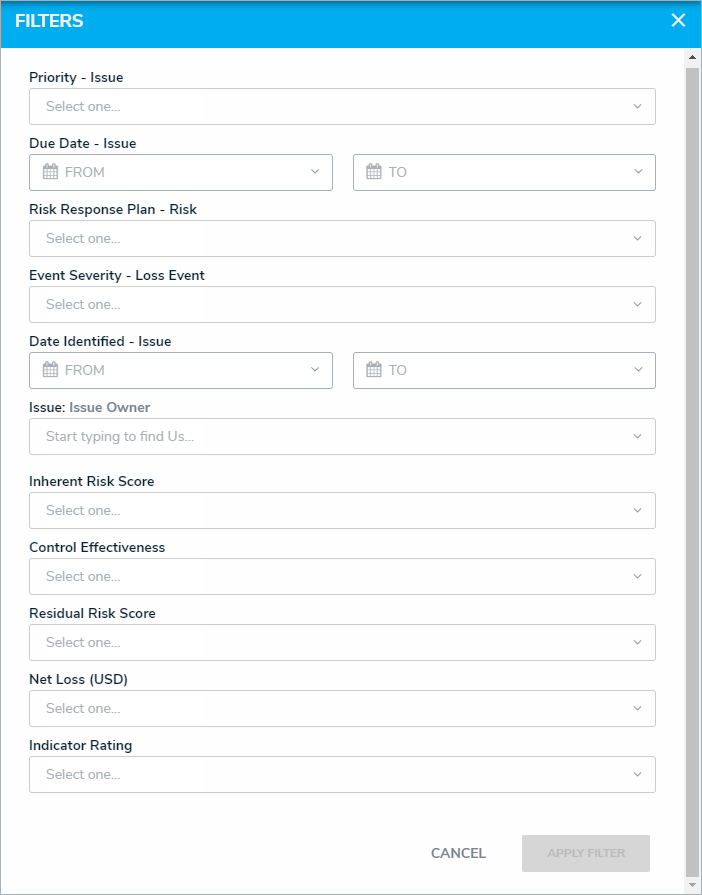 The Filters palette.

To export a report attachment:
- Click the
 icon at the report’s top-right corner to open the Report Attachments palette.
 - Click Export Attachments to download the listed attachments as a .zip file.
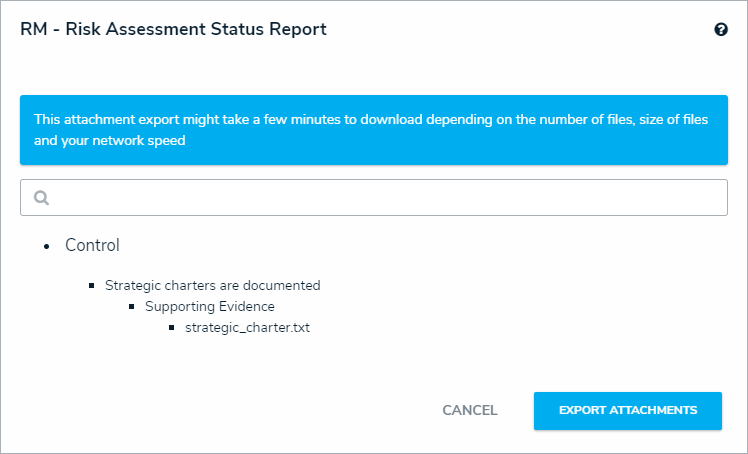 The Report Attachments palette.
| To refresh report data, click the |