Overview
The Filters feature allows users to add internal Filters to the Chart's data values. These Filters are part of the Chart and will be retained in all instances of the Chart across the entire application. Furthermore, they are not visible outside the edit mode and can’t be used for interaction.
User Account Requirements
The user account you use to log into Resolver must have Administrator permission or Data Management advanced permissions to add a Chart Filter.
Related Information/Setup
To add styles to your Chart, please see the link below:
Please see the corresponding articles below for Information on Adding a Chart Type not covered by these instructions.
- Adding a Chart to a Dashboard
- Adding a Multi-Series Chart to a Dashboard
- Adding a Combo Chart to a Dashboard
- Adding a Table to a Dashboard
- Adding a Crosstab to a Dashboard
- Adding a Heatmap to a Dashboard
- Adding a Map to a Dashboard
- Adding a Box and Whiskers Chart to a Dashboard
Navigation
- From the Home screen, click the Administration icon.
![]()
Administration Icon
- From the Administrator Settings menu, click the Admin Overview link.
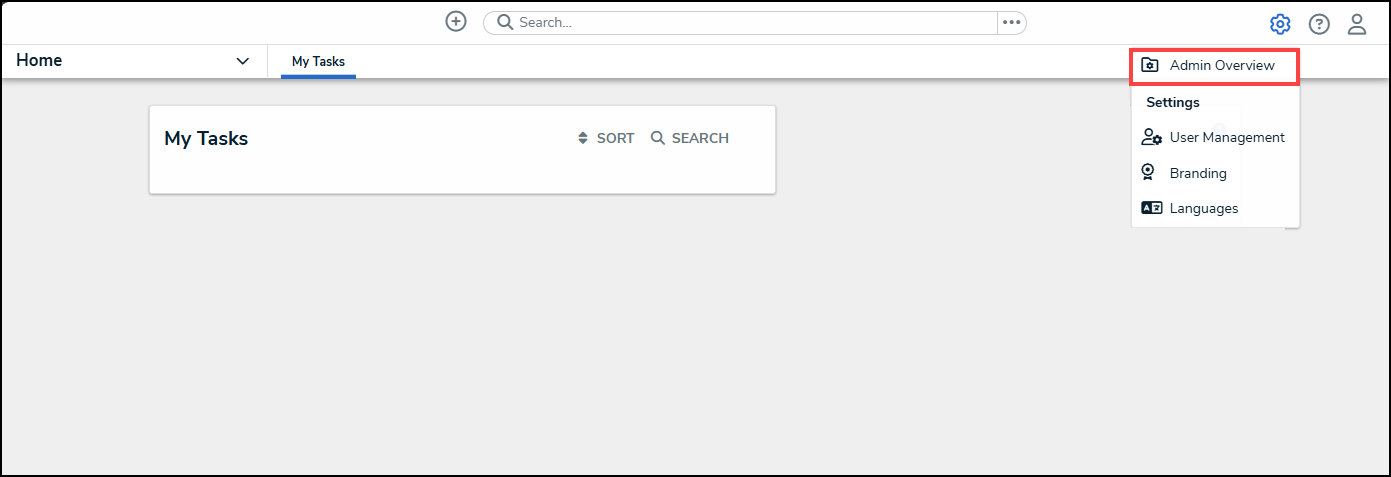
Administrator Settings Menu
- From the Admin Overview screen, click on the Dashboard Builder tile under the Views section.

Dashboard Builder Tile
- From the Dashboard Builder screen, click a Dashboard Name.
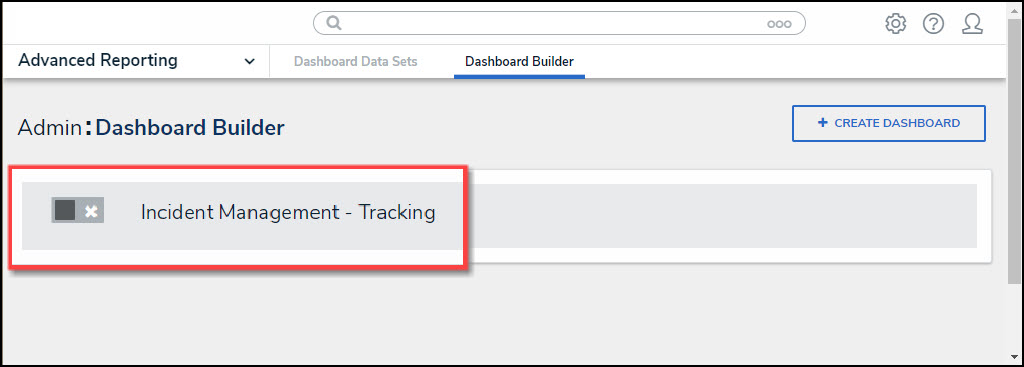
Dashboard Name
- From the Dashboard screen, to access the Chart screen, click on the Add Chart button.

Add Chart Button
- Or click the More Options icon on an existing Chart View.

More Options Icon
- Click the Edit option from the More Options dropdown menu.

Edit Option
- From the Chart screen, click the Filters panel from the Configuration panel.

Filters Panel
- Click the +Add Filters link.

+ Add Filters Link
Adding a Chart Filter
- From the Filter screen, enter a Column name in the Column field to narrow the search results.

Filter Screen
- Click the Column you want to use to Filter the Chart.
- Pick a Condition from the Is dropdown menu. Conditions on the Is dropdown menu will vary depending on if the selected Column has a Numeric, Date, or Text Label value.

Is Dropdown Menu
Numeric:
- Equals: The Equals Condition is met if a value(s) on the Chart equals the Value in the Value field.
- Does not equal: The Does not equal Condition is met, if a value(s) on the Chart does not equal the Value in the Value field.
- Less than: The Less than Condition is met If a value(s) on the Chart is less than the Value in the Value field.
- Greater than: The Greater than Condition is met, if a value(s) on the Chart is greater than the Value in the Value field.
- Less than or equal to: The Less than or equal to Condition is met if a value(s) on the Chart is less than or equal to the Value in the Value field.
- Greater than or equal to: The Greater than or equal to Condition is met if a value(s) on the Chart is greater than or equal to the Value in the Value field.
- Between, inclusive: The Between, inclusive Condition is met if a value(s) on the Chart is within the value range, including the edge values (e.g., 0 - 500, will include the edge values 0 and 500). An extra Value field is added when using Between, Inclusive, which allows users to create a value range by entering a numerical value in each Value field. The first Value field is the min value in the range.
- Between, exclusive: The Between, exclusive Condition is met if a value(s) on the Chart is within the value range, excluding the edge values (e.g., 0 - 500, will exclude the edge values 0 and 500). An extra Value field is added when using Between, Exclusive, which allows users to create a value range by entering a numerical value in each Value field. The first Value field is the min value in the range.
- Is null: The Is null Condition is met if a value(s) on the Chart equals null (0), the Condition is met. The Value field is removed and is not used when Is Null is selected.
- Is not null: The Is not null Condition is met if a value(s) on the Chart does not equal null (0), the Condition is met. The Value field is removed and is not used when Is Not Null is selected.
Date:
- In: The In Condition is met if a date value(s) on the Chart is within the date Condition.
- Operator: Select a date Operator from the dropdown menu.
- This: Selecting the This operator allows users to specify the length of time, creating a Date range starting today (e.g., Day, Year, Quarter, Month, Week).
- Date Length: Select the Date Length to apply to the operator from the dropdown menu (e.g., Day, Year, Quarter, Month, Week).
- The last: Selecting The last operator allows users to create a date range based on the last specified period by specifying the amount of time within the date range (e.g., The last 30 Days).
- Value: Enter the length of time in the Value field.
- Date Length: Select the Date Length from the dropdown menu (e.g., Day, Year, Quarter, Month, Week). The Calendar date checkbox is locked if you select Days as a Date Length.
- The next: Selecting The next operator allows users to create a date range based on the next specified period by specifying the amount of time within the date range (e.g., The next 30 Days).
- Value: Enter the length of time in the Value field.
- Date Length: Select the Date Length from the dropdown menu (e.g., Day, Year, Quarter, Month, Week). The Calendar date checkbox is locked if you select Days as a Date Length.
- This: Selecting the This operator allows users to specify the length of time, creating a Date range starting today (e.g., Day, Year, Quarter, Month, Week).
- Calendar Dates:
- Enable: Uses a calendar-based approach to calculating filter date ranges. A calendar-based approach considers the start and end date of the selected date range.
- Disable: Uses a rolling date range calculation which allows the start and end date to move depending on today's date (e.g., for the last two years, if today’s date is 2/8/2021, the filter range will be 2/8/2019 through 2/8/2021 today and change to 2/9/2019 to 2/9/2021 tomorrow).
- Include Starting Date: Includes (enabled) or excludes (disabled) the starting date in the range.
- Current Date: Enter the number of days in the Date field. The Date field determines the number of days included within the Condition range (e.g., The Last 30 days, if 30 is entered in the Date field and The Last is selected from the Operator dropdown menu).
- Date Selected: This will indicate the start and end dates included in the date range.
- Operator: Select a date Operator from the dropdown menu.
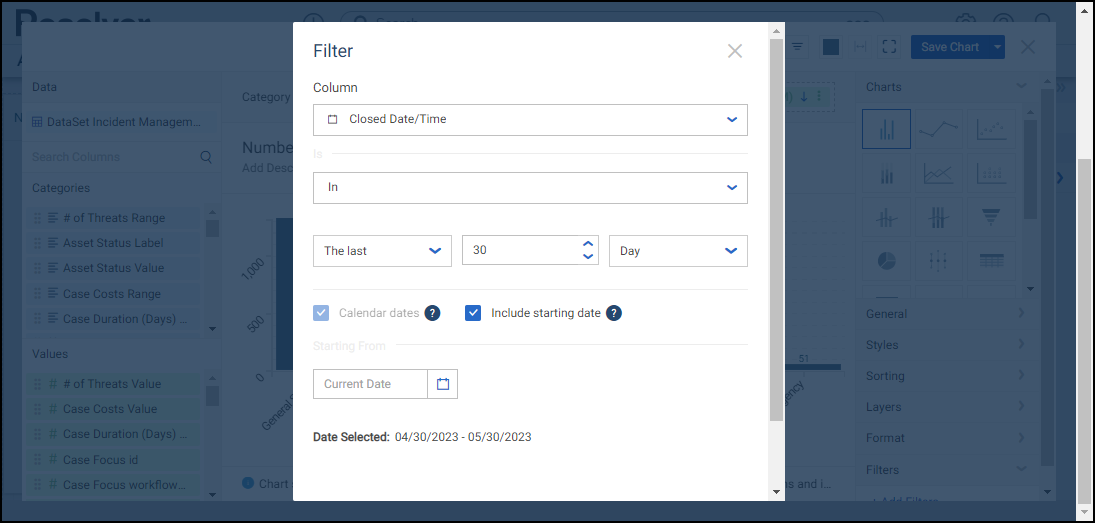
In Date Option
- Before: The Before Condition is met if a value(s) on the Chart is within the date range before the specified date (e.g., before 01/01/2023).
- Date Length: Select the Date Length from the dropdown menu (e.g., Year, Quarter, Month, Week).
- Date: Select a Date from the Calendar pop-up or use the slide bar to select a Date to indicate the end date of the Condition range.
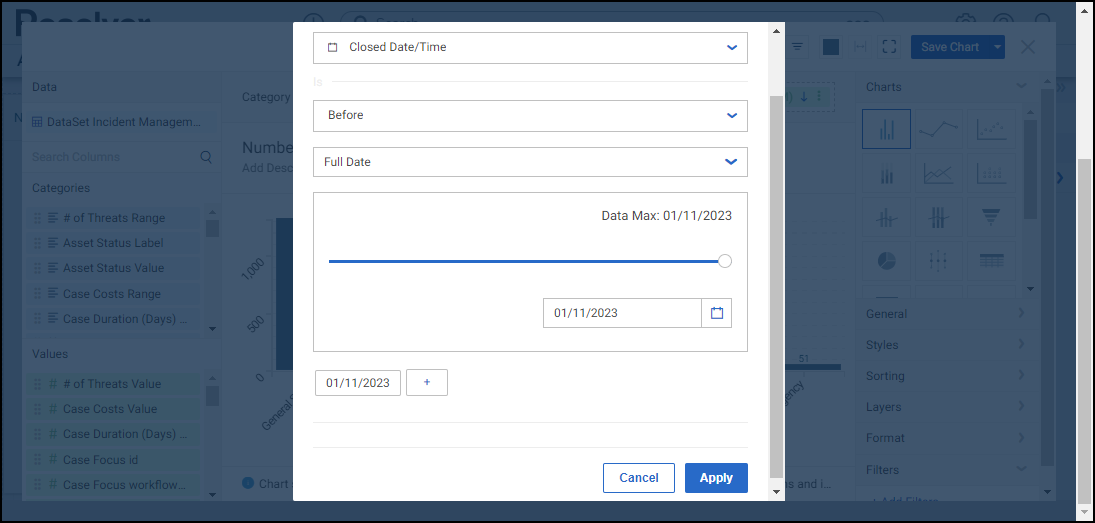
Before Option
- Before or on: The Before or on Condition is met if a value(s) on the Chart is within the date range before or on the specified date (e.g., before or on 01/01/2023).
- Date Length: Select the Date Length from the dropdown menu (e.g., Year, Quarter, Month, Week).
- Date: Select a Date from the Calendar pop-up or use the slide bar to select a Date to indicate the end date of the Condition range.
- After: The After Condition is met if a value(s) on the Chart is within the date range after the specified date (e.g., after 01/01/2023).
- Date Length: Select the Date Length from the dropdown menu (e.g., Year, Quarter, Month, Week).
- Date: Select a Date from the Calendar pop-up or use the slide bar to select a Date to indicate the beginning date of the Condition range.
- After or on: The After or on Condition is met if a value(s) on the Chart is within the date range after or on the specified date (e.g., after or on 01/01/2023).
- Date Length: Select the Date Length from the dropdown menu (e.g., Day, Year, Quarter, Month, Week). The Calendar date checkbox is locked if you select Days as a Date Length.
- Date: Select a Date from the Calendar pop-up or use the slide bar to select a Date to indicate the beginning date of the Condition range.
- Equals: The Equals Condition is met if a value(s) on the Chart equals the date(s) selected (e.g., equals 01/01/2023).
- Search or type values separated by commas: Search the Data for comma-delimited date values (separated with commas).
- Dates: Select a Date(s) from the generated date list by clicking the checkbox next to the Date. When selecting multiple dates, the OR value is used.
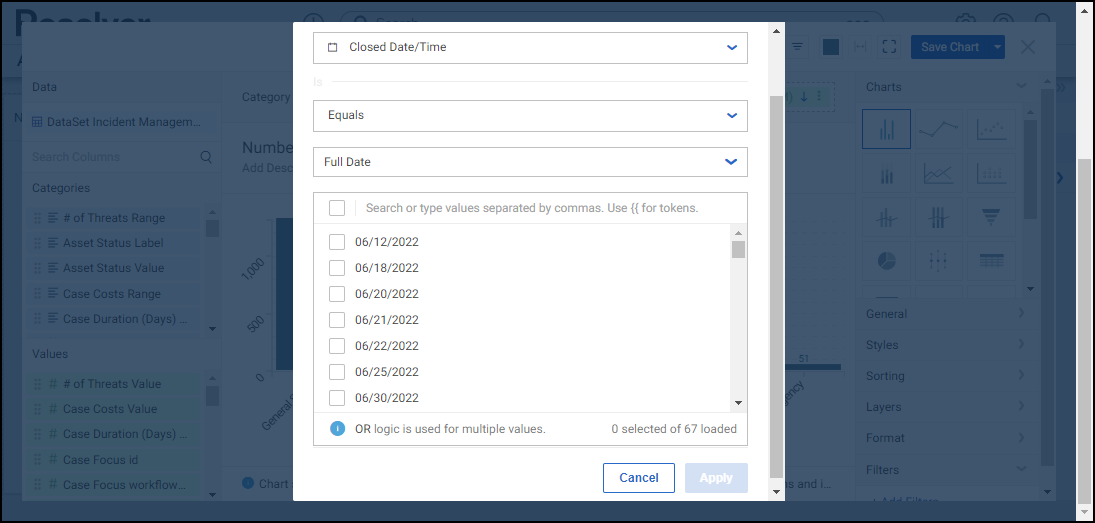
Equals Option
- Does not equal: The Does not equal Condition is met if a value(s) on the Chart does not equal the date(s) selected (does not equal, on 01/01/2023).
- Search or type values separated by commas: Search the Data for comma-delimited date values (separated with commas).
- Dates: Select a Date(s) from the generated date list by clicking the checkbox next to the Date. When selecting multiple dates, the OR value is used.
- Between, inclusive: The Between, inclusive Condition is met if a value(s) on the Chart is within the value range, including the edge values, the Condition is met (e.g., 0 - 500, will include the edge values 0 and 500). An extra Value field is added when using Between, Inclusive, which allows users to create a value range by entering a numerical value in each Value field. The first Value field is the min value in the range.
- Between, exclusive: The Between, exclusive Condition is met if a value(s) on the Chart is within the value range, excluding the edge values (e.g., 0 - 500, will exclude the edge values 0 and 500). An extra Value field is added when using Between, Exclusive, which allows users to create a value range by entering a numerical value in each Value field. The first Value field is the min value in the range.
- Is null: The Is null Condition is met if a value(s) on the Chart equals null (empty). The Value field is removed and is not used when Is Null is selected.
- Is not null: The is not null Condition is met if a value(s) on the Chart does not equal null (empty). The Value field is removed and is not used when Is Not Null is selected.
- Date Selected: When using the In operator, the system will automatically set the Start Date to today's date and extend the ranges end date according to the In operator (e.g., Week, Month, etc.).
- Add New Value: A user can add date values by selecting the plus (+) button. The Add New Value button does not appear for every Date option.
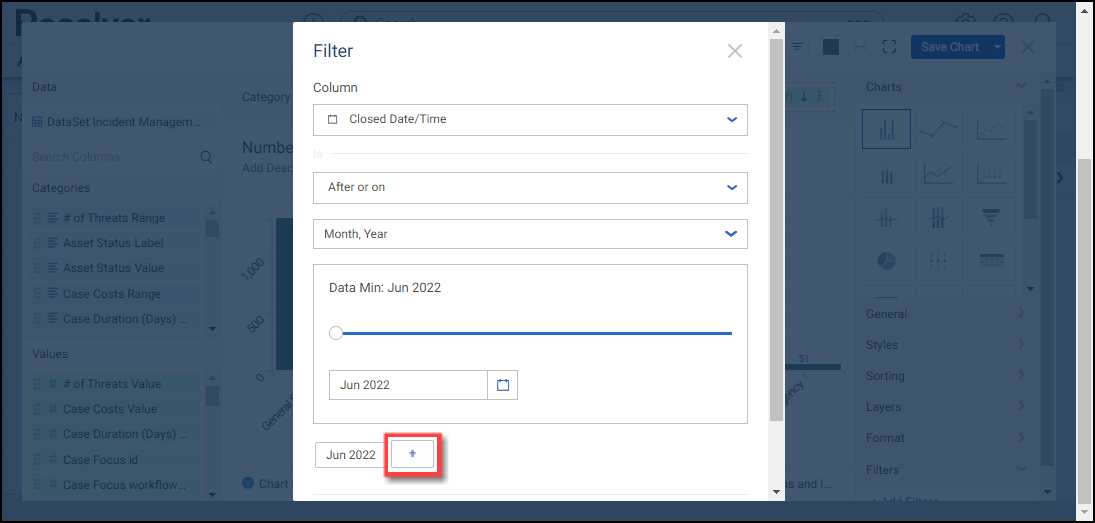
Add New Value Button
Text Label:
- Equals: The Equals Condition is met if a value(s) on the Chart equals the Text Value(s) selected (e.g., equals Person Incident).
- Search or type values separated by commas: Search the Data for comma-delimited Text Values (separated with commas).
- Text: Select Text Values from the generated list by clicking the checkbox next to the Text Value. When selecting multiple Text Values, the OR value is used.
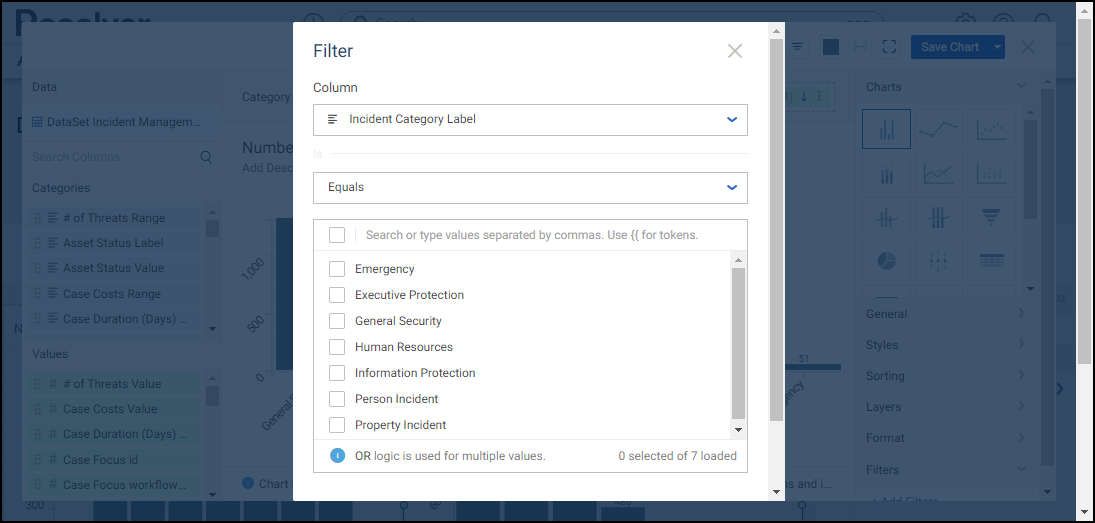
Equals Option
- Does not equal: The Does not equal Condition is met if a value(s) on the Chart does not equal the Text Value(s) selected (e.g., equals Person Incident).
- Search or type values separated by commas: Search the Data for comma-delimited Text Values (separated with commas).
- Text: Select Text Values from the generated list by clicking the checkbox next to the Text Value. When selecting multiple Text Values, the OR value is used.
- Starts with: If a value(s) on the Chart starts with the Text Value entered, the Condition is met (e.g., starts with "e" = Emergency).
- Text Value: Enter the first few starting text characters in the Text Value(s) you want to include in the Chart and press Enter to add the text value to the Selected Text Value field.
- Selected Text Value: The Selected Text Value field displays all the text values to include within the Chart.
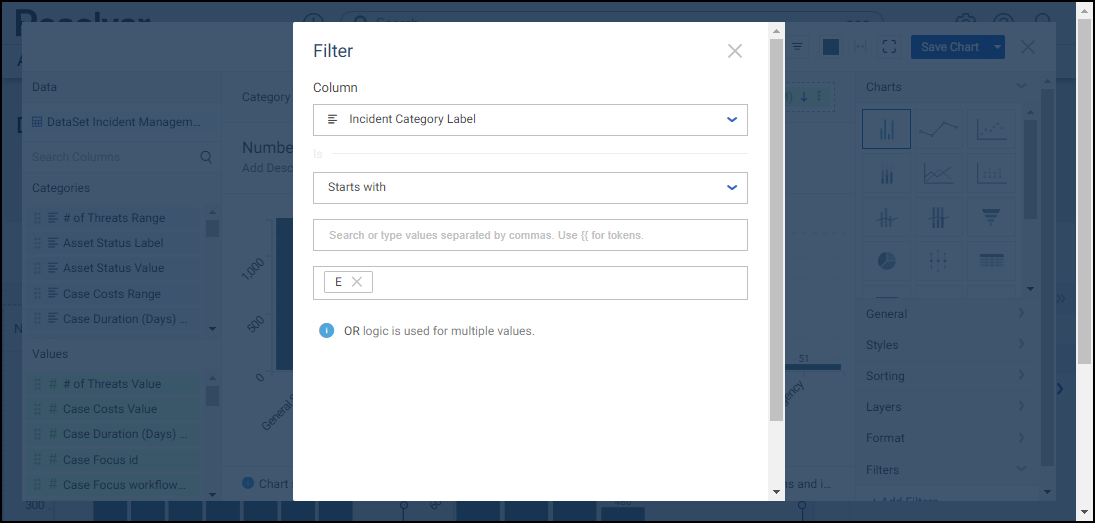
Starts With Option
- Does not start with: The Does not start with Condition is met if a value(s) on the Chart does not start with the Text Value entered (e.g., does not start with "e" = Personal Injury, etc.).
- Text Value: Enter the first few starting text characters in the Text Value(s) you do not want to include in the Chart and press Enter to add the text value to the Selected Text Value field.
- Selected Text Value: The Selected Text Value field displays all the text values to excluded from the Chart.
- Contains: The Contains Condition is met if a value(s) on the Chart does contain the Text Value entered (e.g., contains "e" = Personal Injury, etc.).
- Text Value: Enter text characters in the Text Value(s) you want to include in the Chart and press Enter to add the text value to the Selected Text Value field.
- Selected Text Value: The Selected Text Value field displays all the text values to include from the Chart.
- Does not contain: The Does not contain Condition is met if a value(s) on the Chart does not contain the Text Value entered (e.g., does not contain "e" = Injury, etc.).
- Text Value: Enter the text characters in the Text Value(s) you do not want to include in the Chart and press Enter to add the text value to the Selected Text Value field.
- Selected Text Value: The Selected Text Value field displays all the text values to excluded from the Chart.
- Ends with: The Ends with Condition is met if a value(s) on the Chart does end with the Text Value entered (e.g., ends with "y" = Personal Injury, etc.).
- Text Value: Enter the text characters in the Text Value(s) you want to include in the Chart and press Enter to add the text value to the Selected Text Value field.
- Selected Text Value: The Selected Text Value field displays all the text values to include from the Chart.
- Does not end with: The Does not end with Condition is met if a value(s) on the Chart does not end with the Text Value entered (e.g., does not end with "e" = Personal Injury, etc.).
- Text Value: Enter the first few starting text characters in the Text Value(s) you do not want to include in the Chart and press Enter to add the text value to the Selected Text Value field.
- Selected Text Value: The Selected Text Value field displays all the text values to excluded from the Chart.
- Is null: The Is null Condition is met if a value(s) on the Chart equals null (empty). The Value field is removed and is not used when Is Null is selected.
- Is not null: The Is not null Condition is met if a value(s) on the Chart does not equal null (empty). The Value field is removed and is not used when Is Not Null is selected.
- When you have created your filter condition, click the Apply button to apply the condition to the Chart.
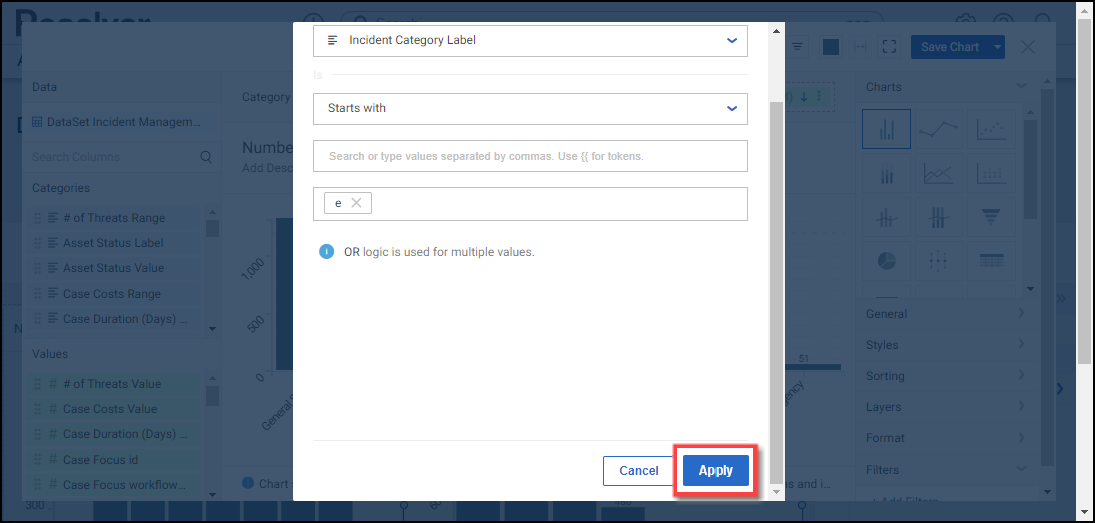
Apply Button