When creating a new report, you must create the report container (instructions below), select an anchor, then create one or more data definitions. Note that reports created prior to Version 3.0 are configured to display archived data by default. Reports created after Version 3.0 are configured to exclude archived data by default. See the Data Analytics Export Report or Data Grid sections for information on creating an export report or data grid.
 | This article provides instructions for creating a report container. After you've completed these steps, you'll need to add one or more element (chart, table, heatmap, etc.) to display data in the report, then add the report to a view to make it available to end-users. See the Report Elements section and Create a Report View article for more information. |
To create a new report:
- Ensure the data definitions you intend to use for the report focus and data series have been created from the Data Definitions settings in the administrative settings.
- Click the
 icon in the top bar > Data Visualizations in the Views section.
 - Click Create Data Visualization.
- Enter the name of the report in the Name field.
- Optional: Enter a description of the report. This description will appear below the report’s name on the Data Visualization page.
- Select Report from the Type dropdown menu. If you're creating a data analytics export or data grid, see the Create a Data Analytics Export Report or Create a New Data Grid articles for more information.
- Select a report focus from the Focus dropdown menu. For example, if you wish to
create a report that displays data on the risks and controls at each location in your company, you would select a report focus with the Location object type as your anchor and no other object types (leaves) selected.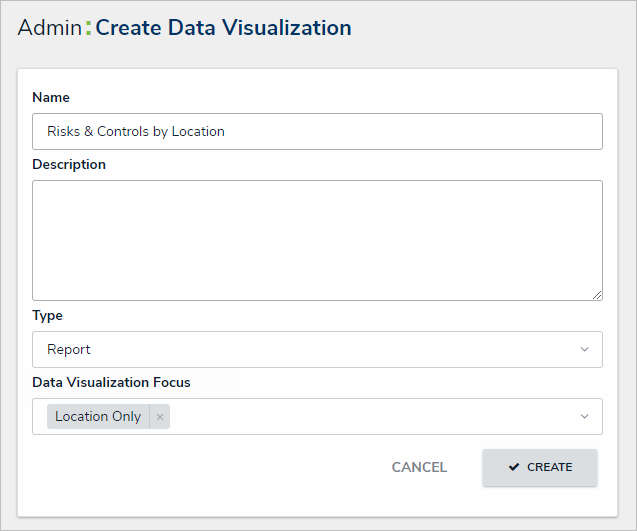 The Create Data Visualization page.
 - Optional: Select additional, related report focus definitions from the Focus dropdown menu. Selecting another report focus will provide more data series options to choose from when adding a report element (table, chart, heat map, or repeatable form).
- Click Create to display the Edit Report page.
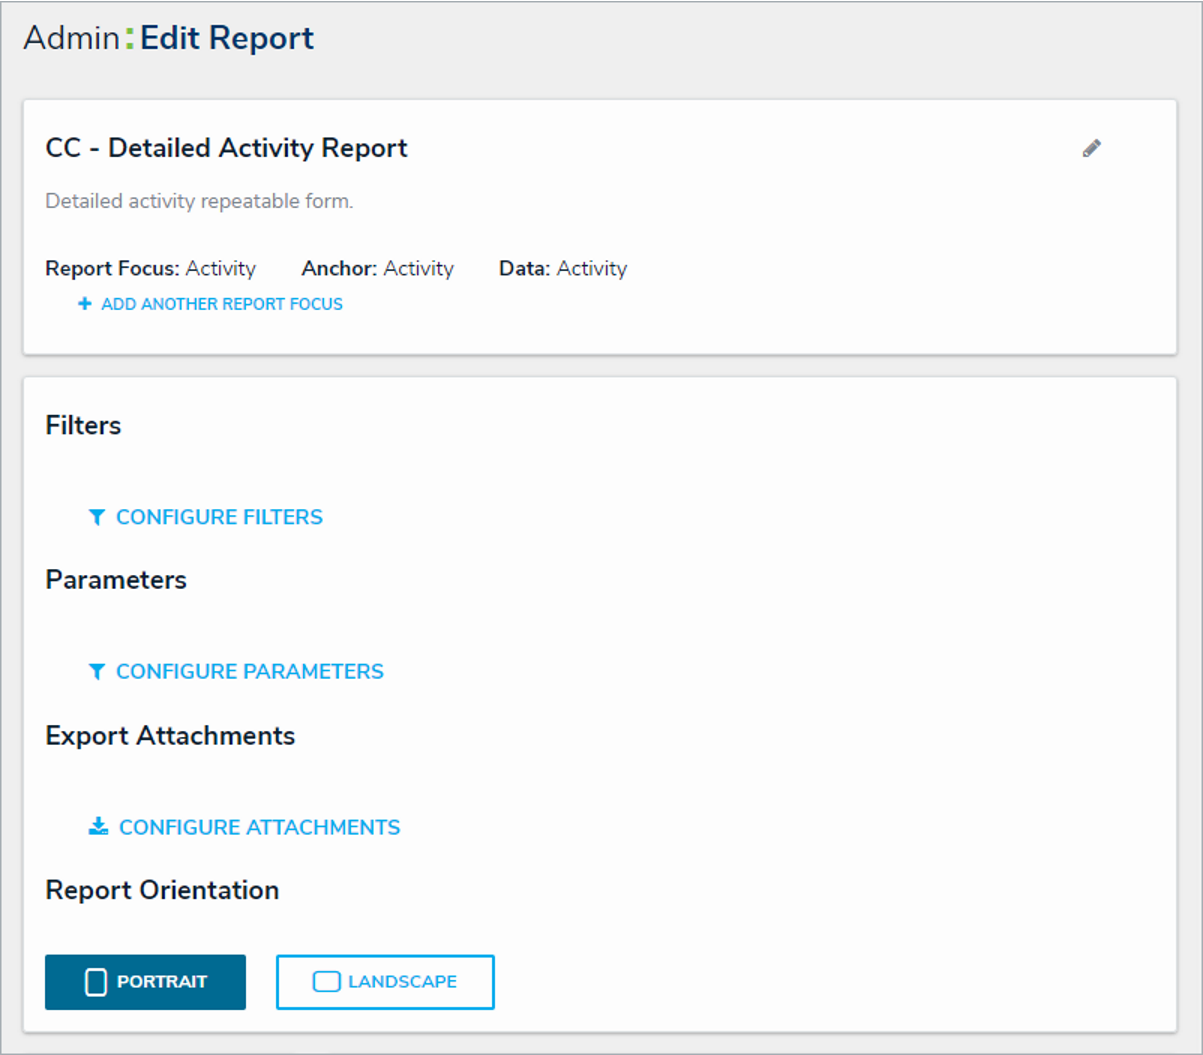 The Admin: Edit Report page.
 - Optional: To edit the report name or add a description, click the
 icon at the top-right of the first section on the page.
 - Optional: To include or exclude archived data, click theicon, then select or deselect the Include archived data in report checkbox. When selected, the report elements will display data from objects that are currently in an archived state. See the Archived Data section for more details.
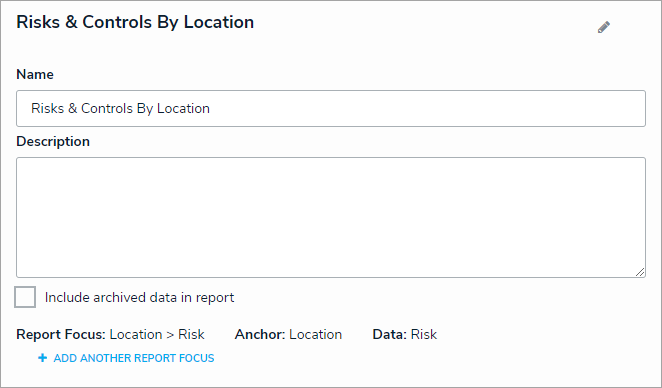 View of Risks & Controls by Location.
 - Optional: Click Add Another Report Focus to include another report focus definition. Depending on the data path, selecting another report focus will provide more data series options to choose from when adding a report element (table, chart, heat map, or repeatable form).
 icon in the top bar > Data Visualizations in the Views section.

 icon at the top-right of the first section on the page.
Once you’ve created the report and selected one or more report focus definitions, you can add charts, tables, heat maps, or repeatable forms, filters, parameters, or text. Reports can then be accessed in an activity by adding it to a report view.
Overview
An Administrator or Data Management advanced permissions user can create a new Data Analytics Export report. Data Analytics Export reports are data visualizations that are specifically designed to allow end users to export object data (properties, fields, workflow states, relationships, and references) into an Excel spreadsheet.
User Account Requirements
The user account used to log into Resolver must have Administrator permission or Data Management advanced permissions to create a Data Analytics Export Report.
Related Information/Setup
Please refer to the Add a View to an Activity article for more information on adding a Data Analytics Export report to a View.
Please refer to the Add an Action to an Activity in Resolver Core article for more information on adding a Data Analytics Export report to an Action.
Please refer to the Export Data Action on Forms in Resolver Core article for more information on adding a Data Analytics Export report to Export Data.
Navigation
- From the Home screen, click on the Administration icon.
![]()
Administration Icon
- From the Administrator Settings menu, click Admin Overview.

Administrator Settings Menu
- From the Admin: Overview screen, click the Data Visualizations tile under the Views section.
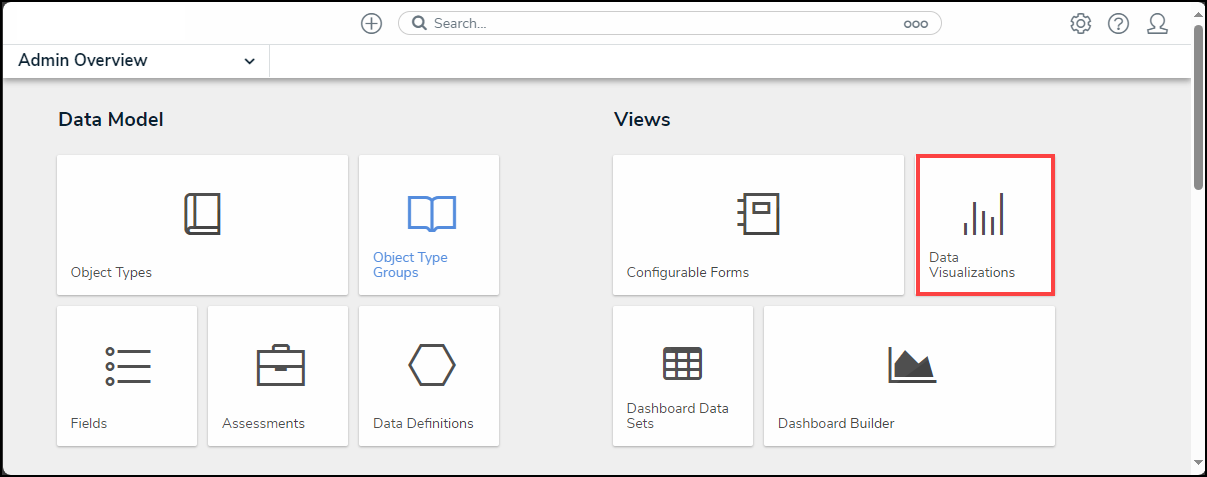
Data Visualizations Tile
- From the Admin: Data Visualizations screen, click the + Create Data Visualizations button.

+ Create Data Visualizations Button
Creating a Data Analytics Export Report
Ensure the data definition you wish to use for the data analytics report has been created from the Data Definitions settings in Administration.
- From the Admin: Create Data Visualization screen, enter a report name in the Name field. The name will represent the report throughout the system.

Name Field
- (Optional) Enter a brief description of the Data Analytics Export in the Description field. The description will appear below the Data Analytics Export's name on the Admin: Data Visualization screen.

Description Field
- Click the Type field and select Data Analytics Export from the dropdown menu.

Type Dropdown Menu
- Click the Data Visualization Focus field and select a focus from the dropdown menu. Enter the name of the focus in the Data Visualization Focus field to narrow the focus list. A Data Visualization Focus is a data definition that broadly specifies which object type’s data will be displayed in a data visualization.

Data Visualization Focus Field
- Click the Create button to create the Data Visualization Export.

Create Button
- The Admin: Edit Report screen will appear. Once the export report has been created, you can grant end users access to it by adding it to a View, Action, or Export Data form action.

Admin: Edit Report Screen
Overview
Administrators and Data Management advanced permissions users can create a new Data Grid. A Data Grid is a data visualization that displays object data in a spreadsheet-style format.
You can create custom data grids for the currently logged in user (e.g. My Incidents or My Risks) by applying the Current User parameter to the data grid element. See step 24 below for more information.
User Account Requirements
The user account used to log into Resolver must have Administrator permission or Data Management advanced permissions to create a Data Grid.
Related Information/Setup
Please refer to the Create a Date Grid View article for more information on creating a Data Grid View.
Navigation
- From the Home screen, click on the Administration icon.
![]()
Administration Icon
- From the Administrator Settings menu, click Admin Overview.
Administrator Settings Menu
- From the Admin: Overview screen, click the Data Visualizations tile under the Views section.
Data Visualizations Tile
- From the Admin: Data Visualizations screen, click the + Create Data Visualizations button.
+ Create Data Visualizations Button
Creating a New Data Grid
Ensure the data definition you wish to use for data grid has been created from the Data Definitions settings in Administration.
- From the Admin: Create Data Visualization screen, enter a Data Grid Name in the Name field. The name will represent the Data Grid throughout the system.

Name Field
- (Optional) Enter a brief description of the Data Grid in the Description field. The description will appear below the Data Grid's name on the Admin: Data Visualization screen.

Description Field
- Click the Type field and select Data Grid from the dropdown menu.

Type Dropdown Menu
- Click the Data Visualization Focus field and select a focus from the dropdown menu. Enter the name of the focus in the Data Visualization Focus field to narrow the focus list. Users can select more than one focus in the Data Visualization Focus field. A Data Visualization Focus is a data definition that broadly specifies which object type’s data will be displayed in a data visualization.

Data Visualization Focus Field
- Click the Create button to create the Data Grid.

Create Button
- From the Admin: Edit Data Grid screen, on the Elements section, click the Expand icon next to Display.
![]()
Expand Icon
- Drag and drop the Data Grid link from the Elements section to the Data Grid Canvas.

Drag and Drop Data Grid Link
- From the Add Data Grid screen, enter a data definition name in the Select a Data Series field to narrow the list.

Select a Data Series Field
- Select a data definition from the Select a Data Series field dropdown menu. The data definition selected here will determine the object data you can display in the Data Grid.

Select a Data Series Field Dropdown Menu
- Click the Done button.

Done Button
- From the Data type tab on the Edit Data Grid pop-up, by default, the Select All checkbox is selected, which will include all data types on the Data Grid. To select individual data types, deselect the Select All checkbox and click on the data types you want to appear on the Data Grid.

Select All Checkbox
- Choose the Data Types that will appear on the Data Grid from the Select Your Data Type field.

Select Your Data Type Field
- Select Library Data from the Select Your Data Type field to also include object type data on the Data Grid.

Library Data
- Click the Columns tab.

Columns Tab
- From the Columns tab, select a Relationship from the Select a Relationship field dropdown menu. Users can choose either the Data Grid Anchor or an Object Type in the data path. The options in the Select a Relationship dropdown menu will vary depending on the data series selected.

Select a Relationship
- (Optional) Click the Search field to narrow the search results on the Select Data list.

Search Field
- Click on the Data Columns to select the columns that will appear on the Data Grid (e.g., properties, workflow states, fields, formulas, relationships) from the Select Data list.

Select Data List
- From the Define Custom Forms section, select the Object can be accessed in the palette from data grid checkbox to enable an icon that appears when hovering a cursor over the Name column in the Data Grid. Clicking the icon displays the object in a pop-up. Users will not be able to view objects in a pop-up if the Name property isn't displayed in the data grid.

Object can be Accessed in the Palette from Data Grid Checkbox
- If you selected the Object can be accessed in the palette from data grid checkbox the Select Form dropdown menu will appear. Select a form from the dropdown menu to choose which form is displayed when the user clicks the palette icon.

Select Form Dropdown Menu
- From the Sort Columns section, users can perform the following actions:
- (Optional) Click the Read Only Icon to prevent users from editing a Data Grid cell.
- (Optional) Click the Delete icon to remove a column from the Data Grid.
- (Optional) Click the Move icon to rearrange the columns on the Data Grid.

Sort Columns Options
- (Optional) Click the Mark all columns as read-only checkbox to automatically mark all Data Grid columns as read-only, preventing users from editing a Data Grid cell.

Mark all columns as read-only Checkbox
- (Optional) Select a Display option radio button.

Display Options Radio Buttons
- (Optional) Select the Display Colored Cells radio button to display formulas or select list cells with text and full background color.
Display Colored Cells
- (Optional) Select the Display Colored Ovals radio button to display formulas or select list cells as text with colored circle background.
Display Colored Ovals
- (Optional) Select the Display No Color radio button to display formulas or select list cells as text with no background.
Display No Color
- Click the Parameters tab.

Parameters Tab
- From the Parameters tab, select a Relationship from the Select a Relationship dropdown menu. The relationship selected here will determine which parameters (filters) you can apply to the Data Grid to refine the data that’s displayed. If needed, you can select a relationship that differs from the relationship selected in the Columns tab.

Select a Relationship Dropdown Menu
- From the Define Parameters section, select one or more parameters to filter the data displayed in the Data Grid. Parameter options include:
- Workflow states
- Select list options
- Formula ranges (e.g. High, Medium, Low)
- Current User. When one or more roles are selected in this parameter, only users within those roles can view the data in the grid. This feature is useful to create customized data grids for specific users. The available roles are determined by the object types in the table's data series
- Date & Time Field or Created On/Modified On properties. Selecting a range in the By [Date Field] dropdown menu will filter the data relative to the value selected in the Date & Time field on the objects. Selecting a range in the By Created On ([Object Type Name]) or By Modified On ([Object Type Name]) dropdown menus will filter the data relative to the date the objects were created or modified. All date-related options filter data in UTC time. It's recommended a date parameter is used to refine large data sets for improved report performance. Options include:
- Today: Show data from today's date only.
- Last [X] Days: Show data within the last 30, 60, 90, or 180 days, relative to today's date.
- Custom: Shows data within the dates selected in the From and To fields. The table will include objects up to the end of that date.

Define Parameters Section
- Click the X icon next to a parameter to delete it from the field.
![]()
X Icon
- Click the Done button to close the Edit Data Grid pop-up. To add another Data Grid, you must create a new Data Grid, only one Data Grid can be added per Data Grid.

Done Button
- Once a grid is successfully created and configured, it must be added to a view in an activity. See the Create a Data Grid View article for more information.
Overview
Before a report can be viewed, an administrator must create and add it to a view in an application. Some Report filters rely on the current user's time zone. Some users from different time zones may see different data in the same Report. See the Time Zone Conversions on Reports article for more information.
User Account Requirements
The data you can view in a Report depends on your role's permissions and the Report's configurations in the administrative settings.
Related Information/Setup
Please refer to the Roles Overview article for more information on role permissions.
Please refer to the Time Zone Conversions on Reports article for more information on time zones.
Please refer to the View a Data Grid and Export Object Data from a Data Analytics Report articles for information on viewing a data grid and data export Report.
Please refer to the Export a Report article for information on exporting a Report.
Please refer to the Loading & Caching Report Data article for more information on refreshing and reloading Report data.
Please refer to the Add Repeatable Forms to a Report article for more information on repeatable forms.
Navigation
- From the Home screen, click the Home dropdown menu.
Home Dropdown Menu
- Select Reports from the dropdown menu.
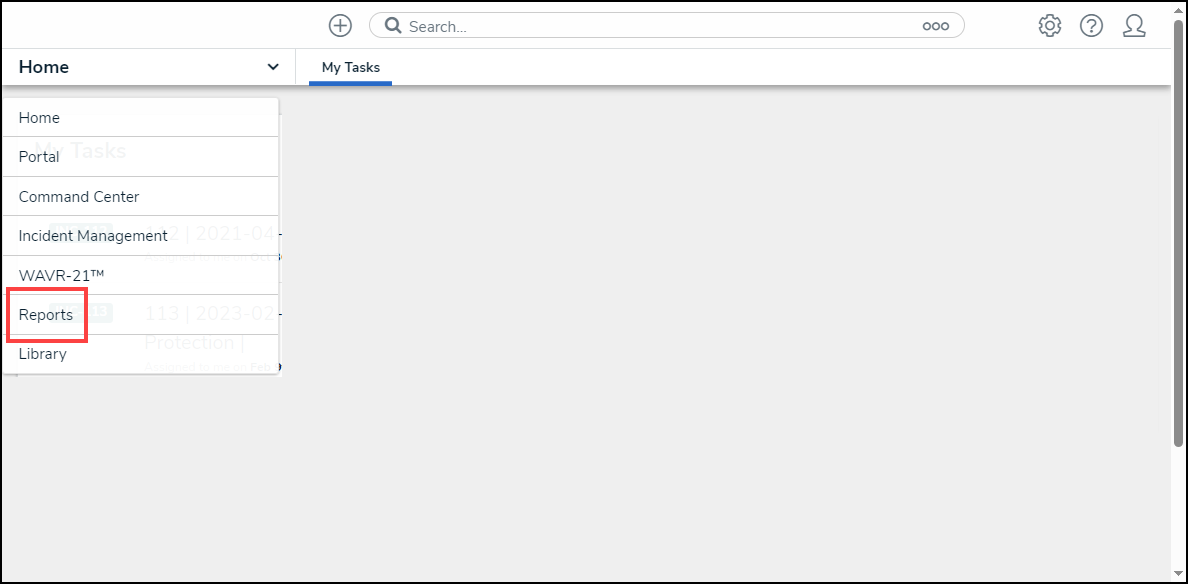
Reports
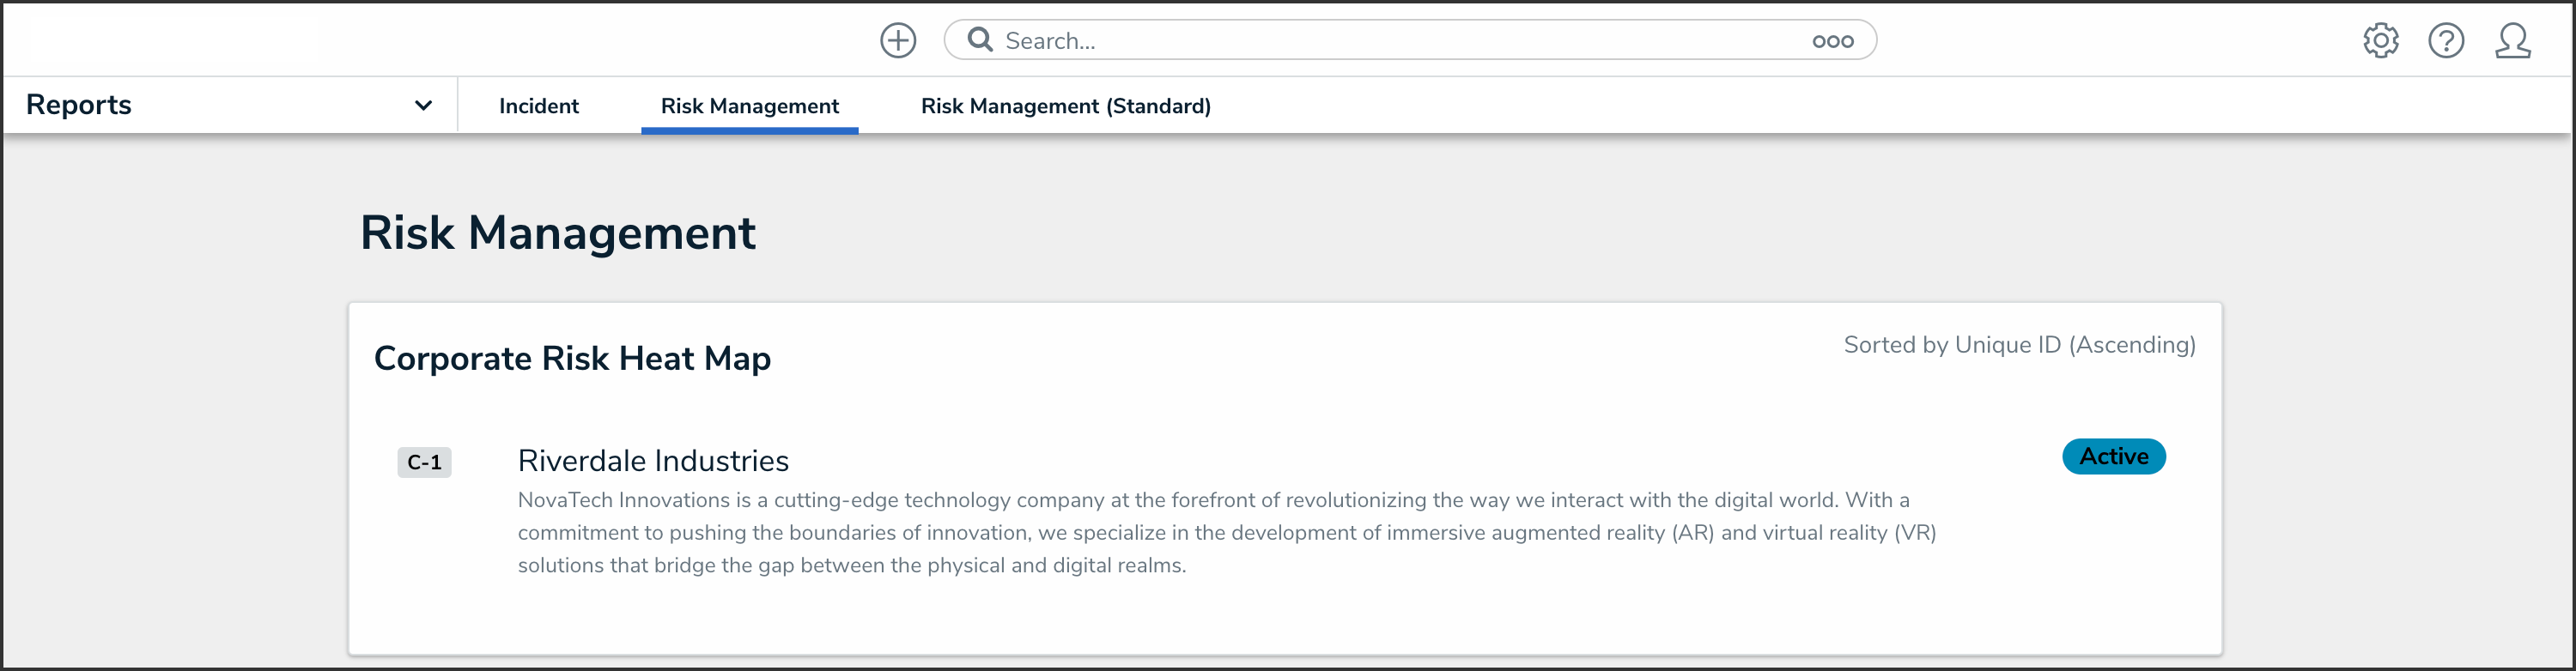
- (Optional) If your organization has multiple Applications, select an Application by clicking the corresponding tab on the Reports screen.
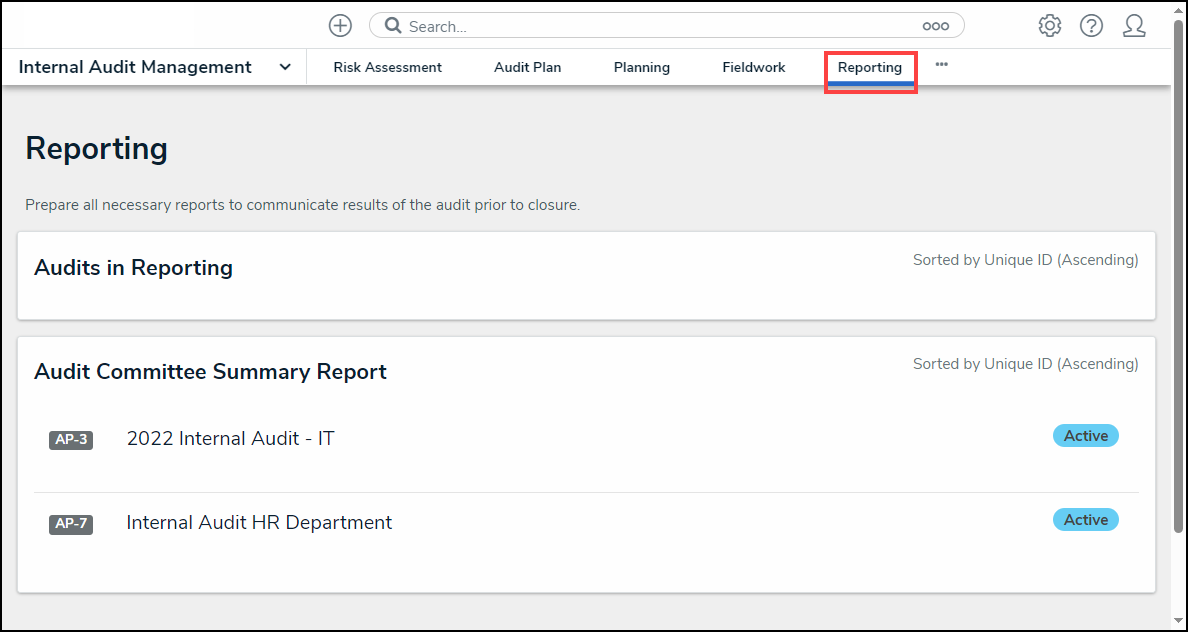
Reports Screen Application Tabs
Viewing a Report
- From the Reports screen, navigate to a Report and click the Report link.
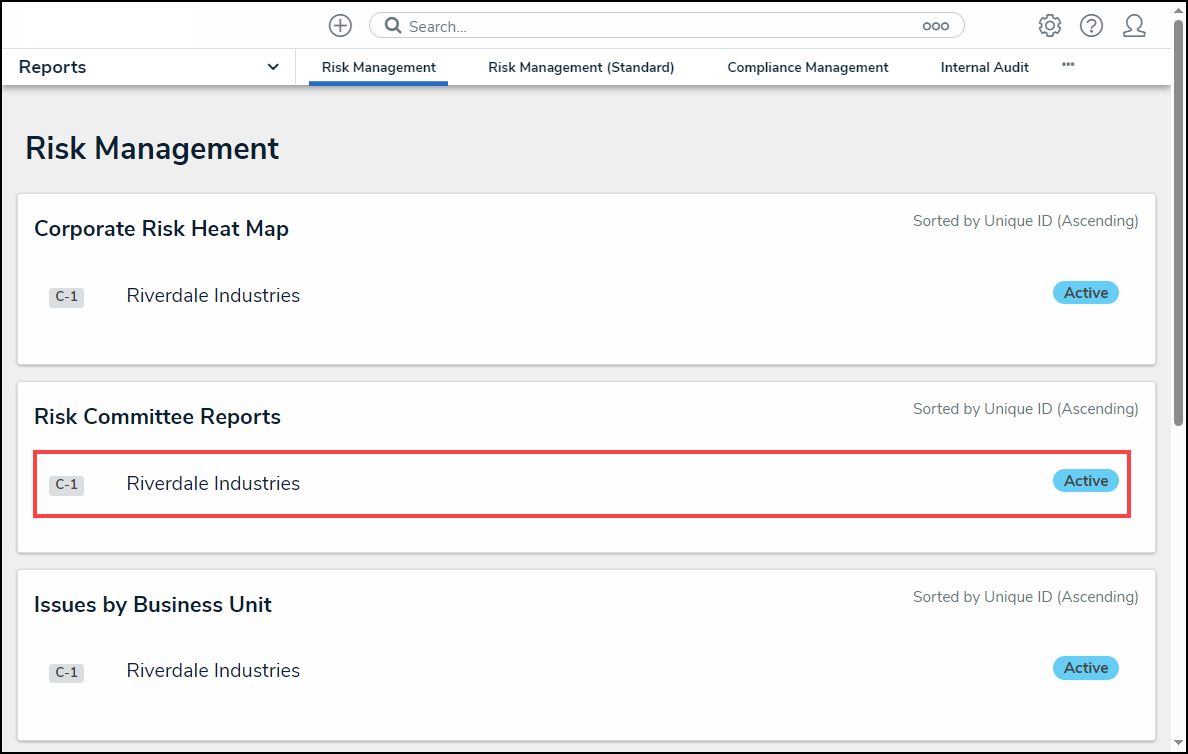
Report Link
- If a Filter is marked as Required by an Administrator during the Report creation, a Filter Report screen will appear, asking the user to fill out all required filters.
 Note:
Note:
The Run Report button will remain greyed out until all required fields are filled out.
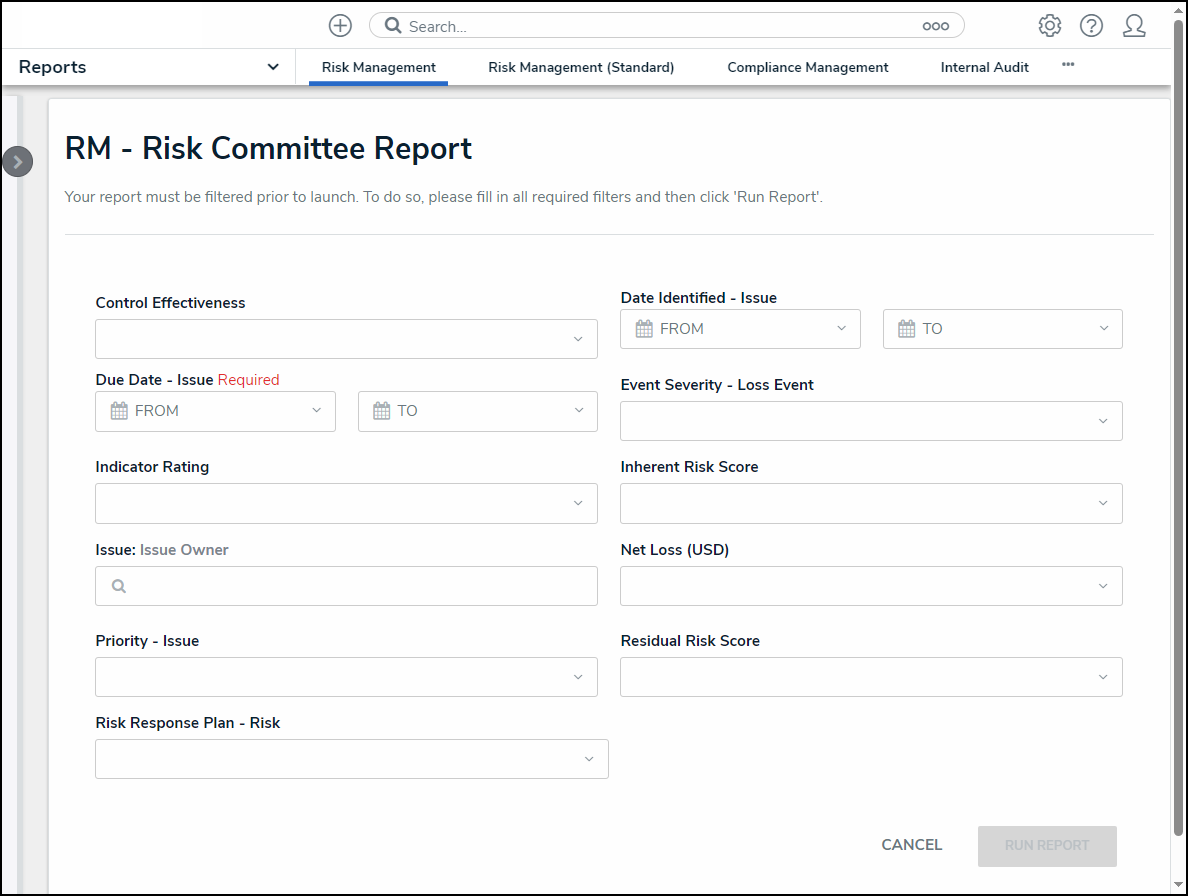
Filter Report Screen
- Fill out all required filters and click the Run Report button to generate the Report.
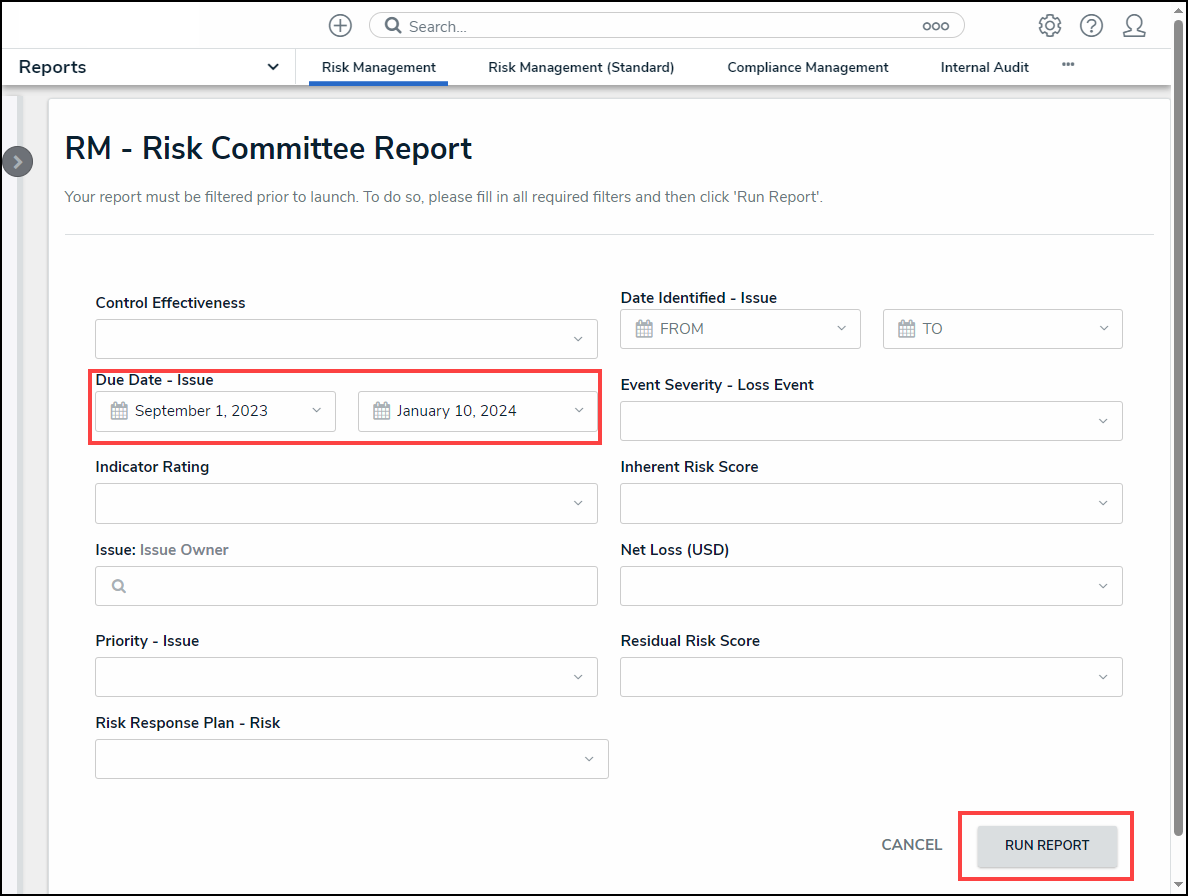
Run Report Button
 Note:
Note:
If an administrator configures, filters can also be applied after loading the Report. See the Filters section below for more information.
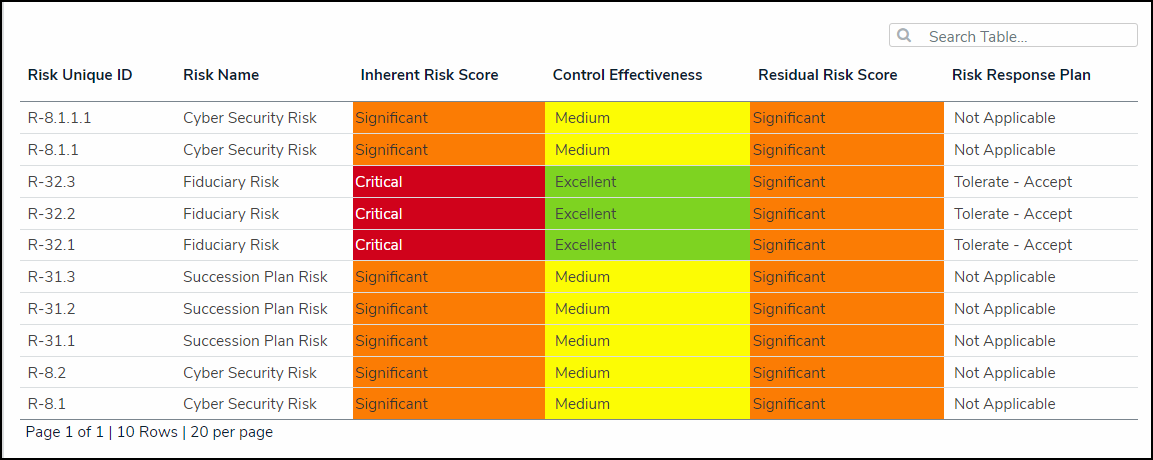
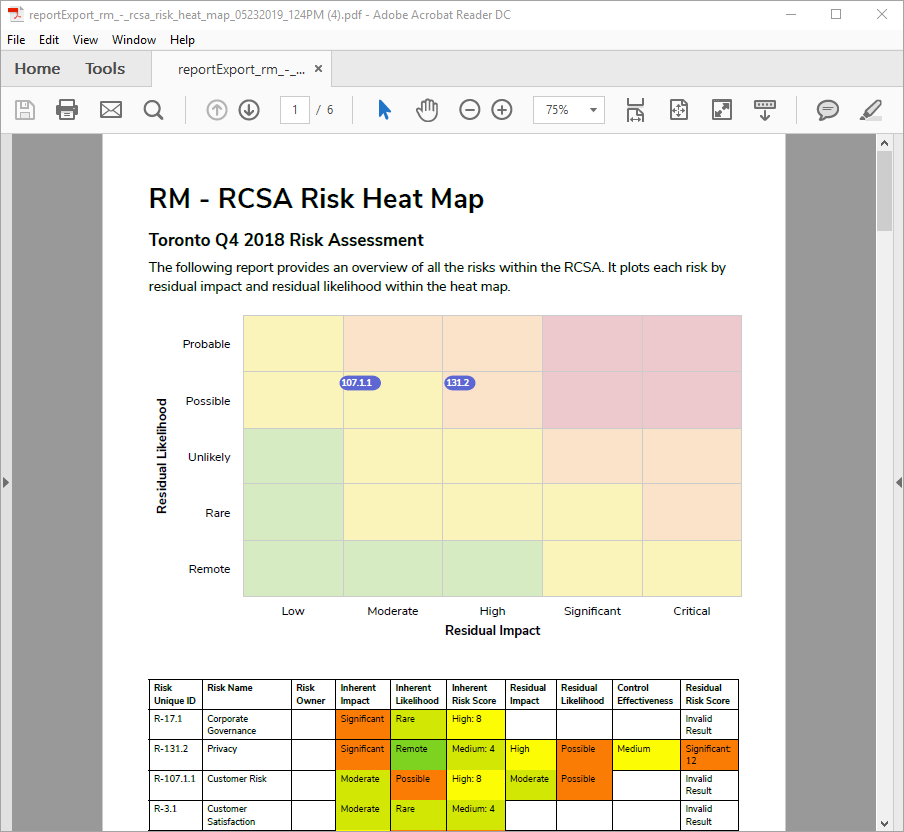
- If the Report includes a bar, column, or pie chart, hover your cursor over the chart for more information about the data.
 Tip:
Tip:
If using a keyboard to navigate, press the Tab key to select a chart or legend and use the Arrow keys to navigate between chart or legend segments or items.
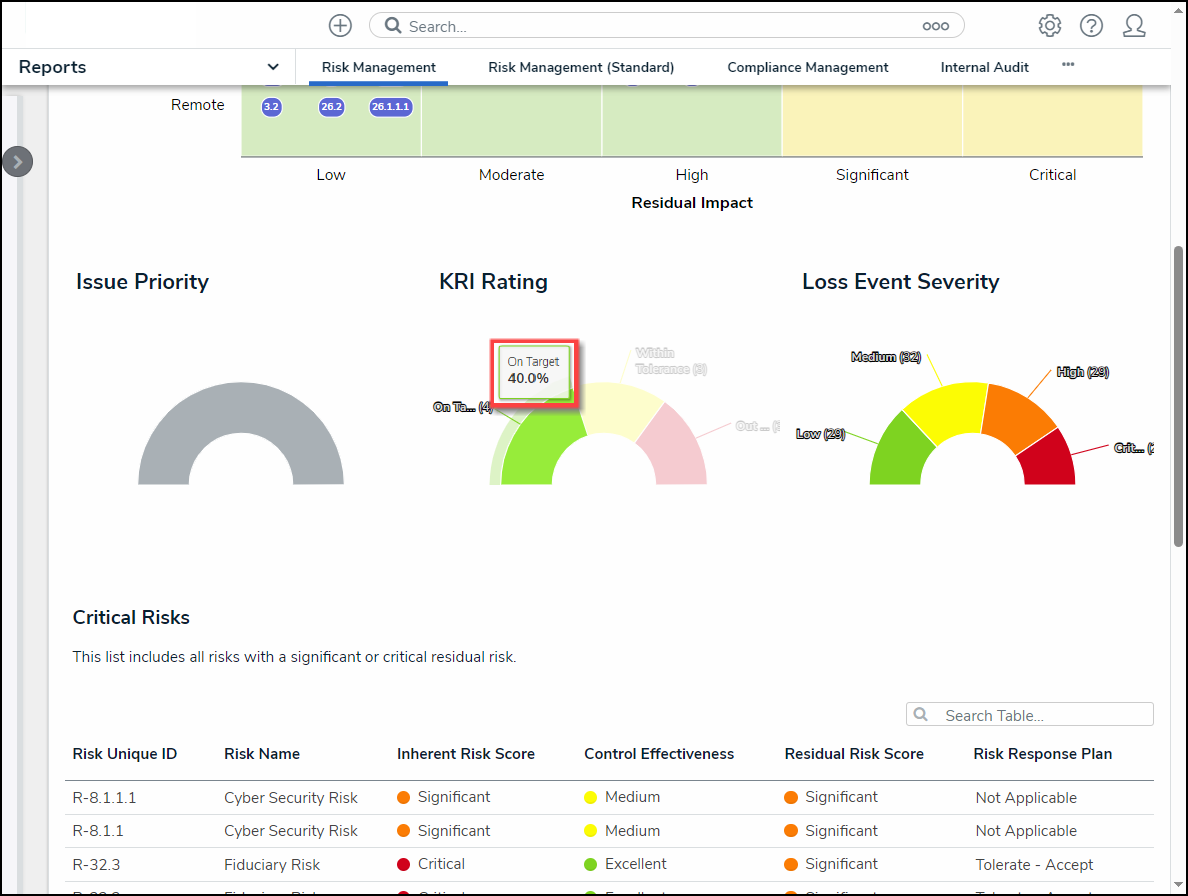
Chart Hover Over
- Clicking on a pie chart section will separate it from the rest of the chart for emphasis.
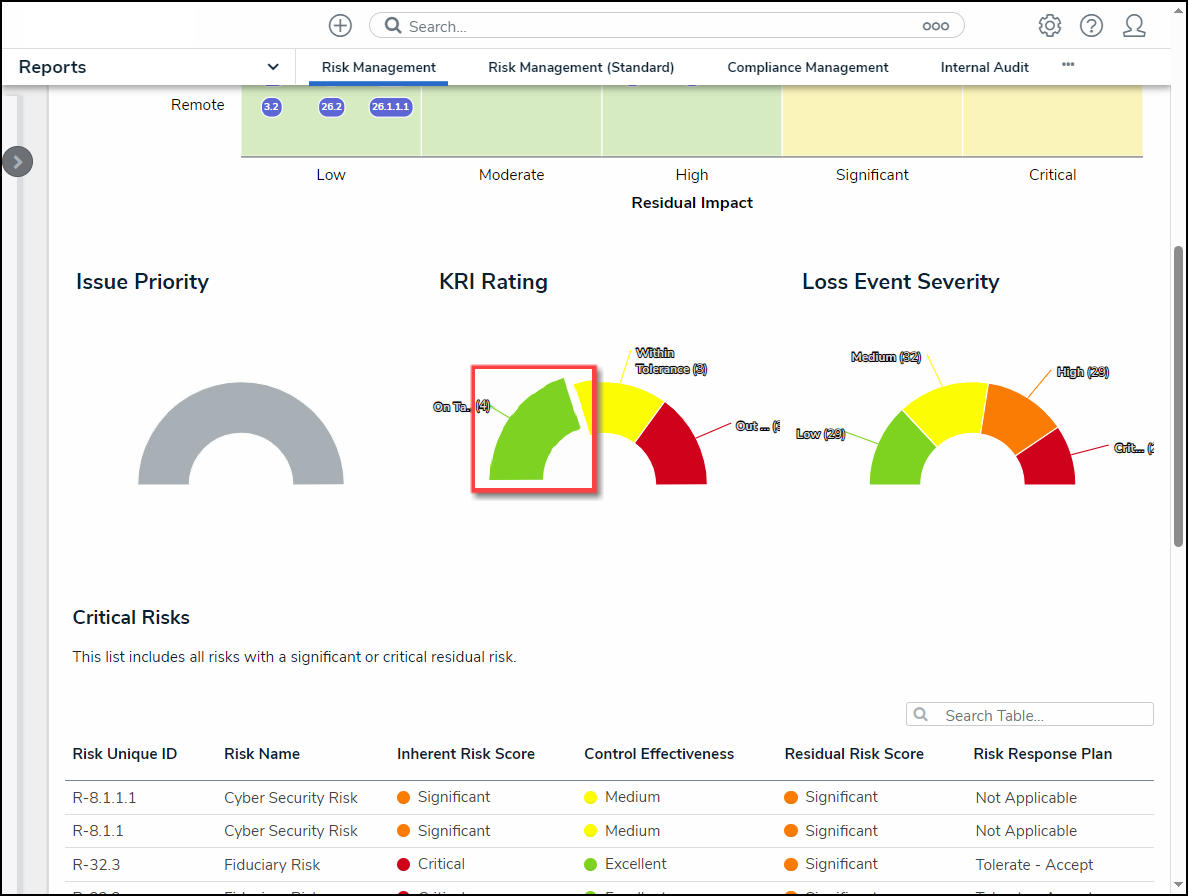
Chart Highlight
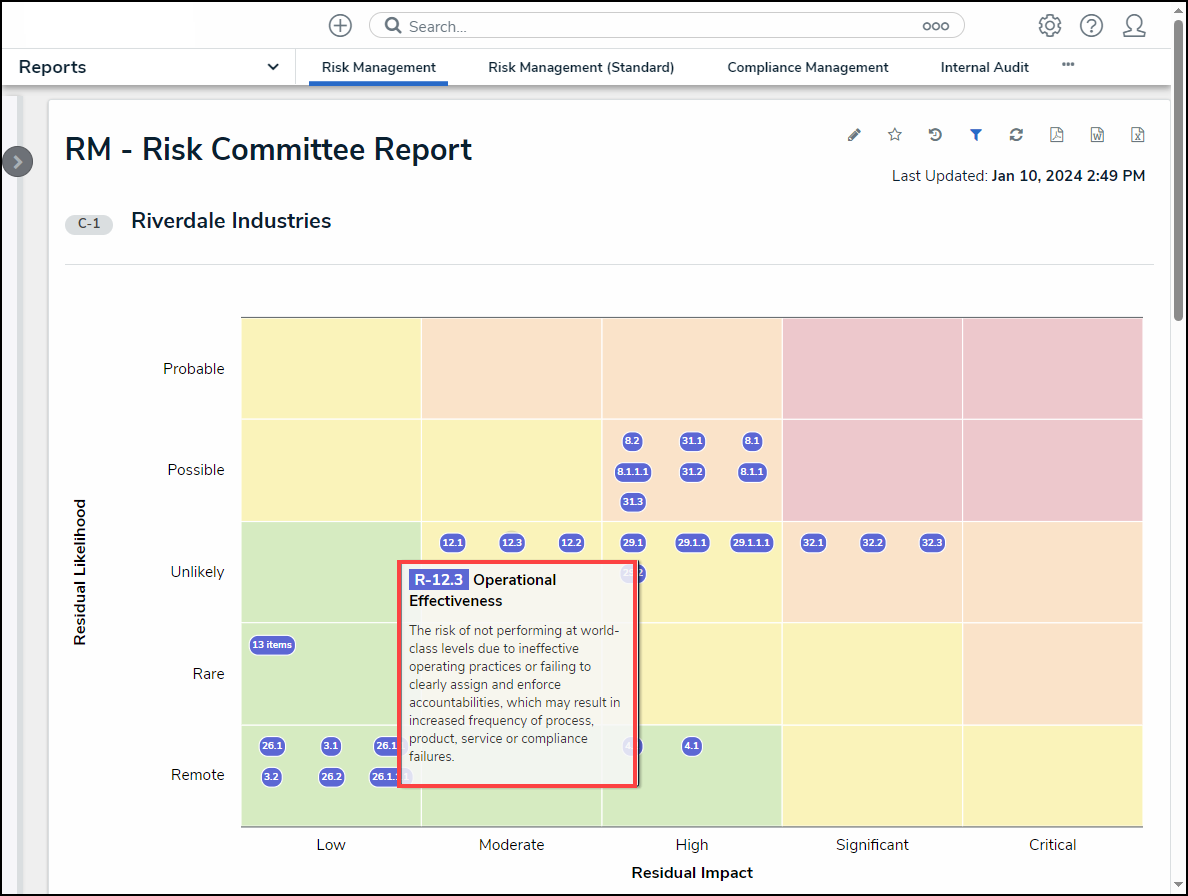
- If the report includes a heat map, hover your cursor over the objects on the heat map (circle and unique IDs) to display the object's description.
Heat Map Object Description
- Click an object (circle and unique IDs) for more detailed information.
More Detail
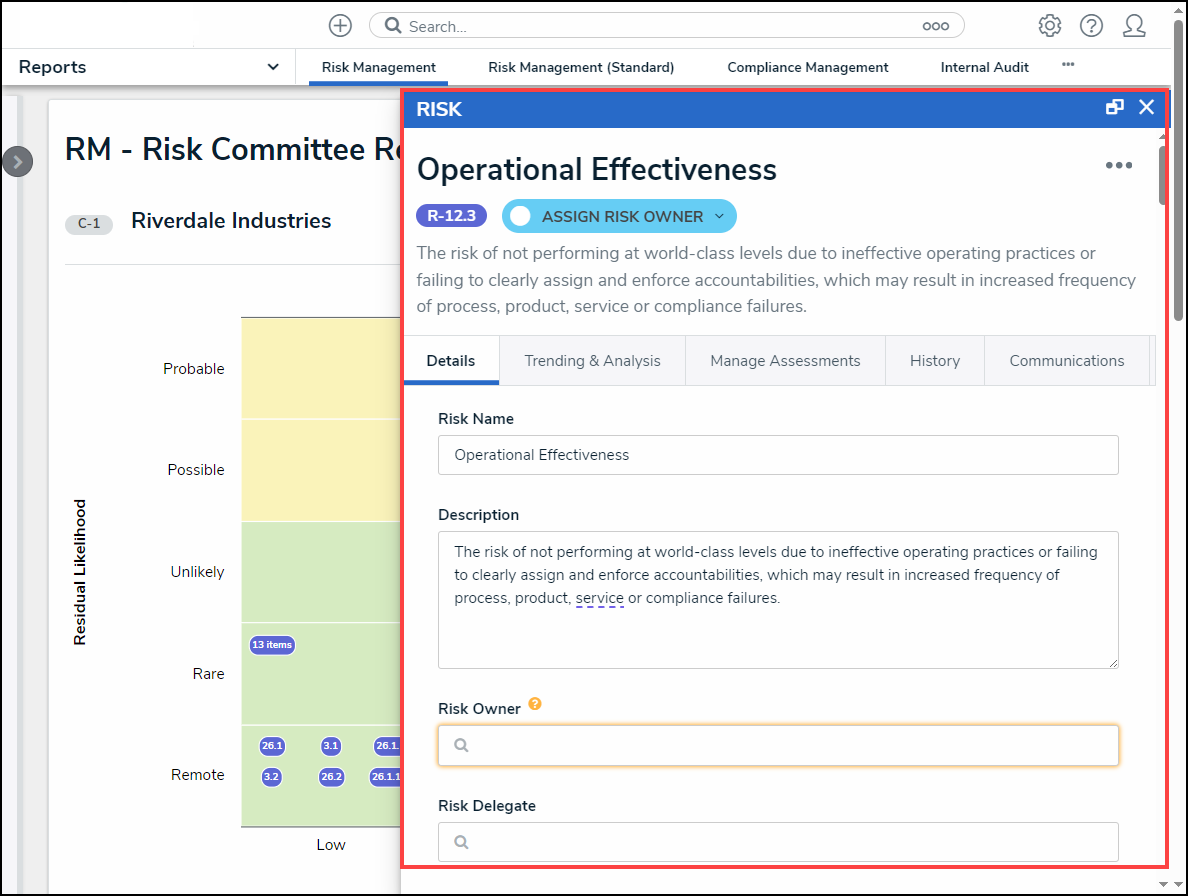
- If the report includes a table, click a cell to open the associated object in a pop-up screen for further details.
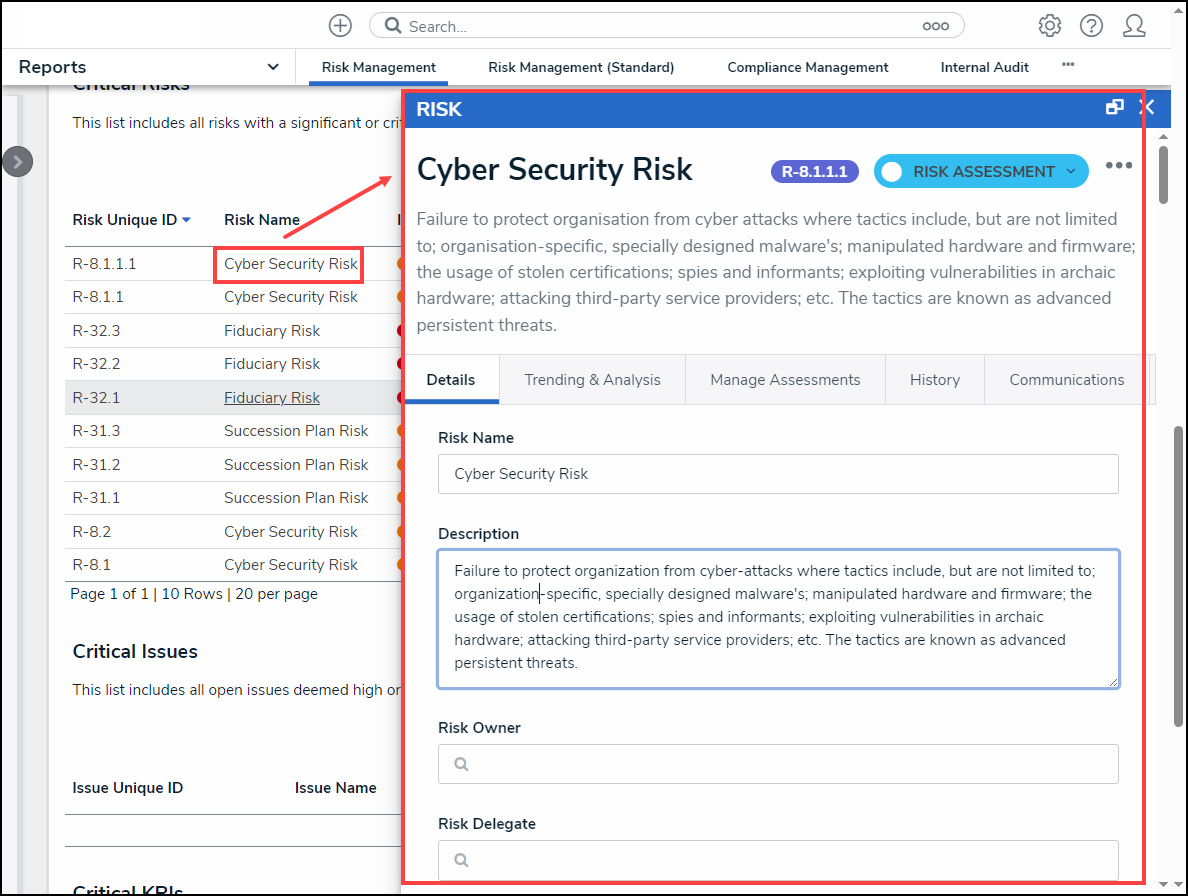
Object Pop-up Screen
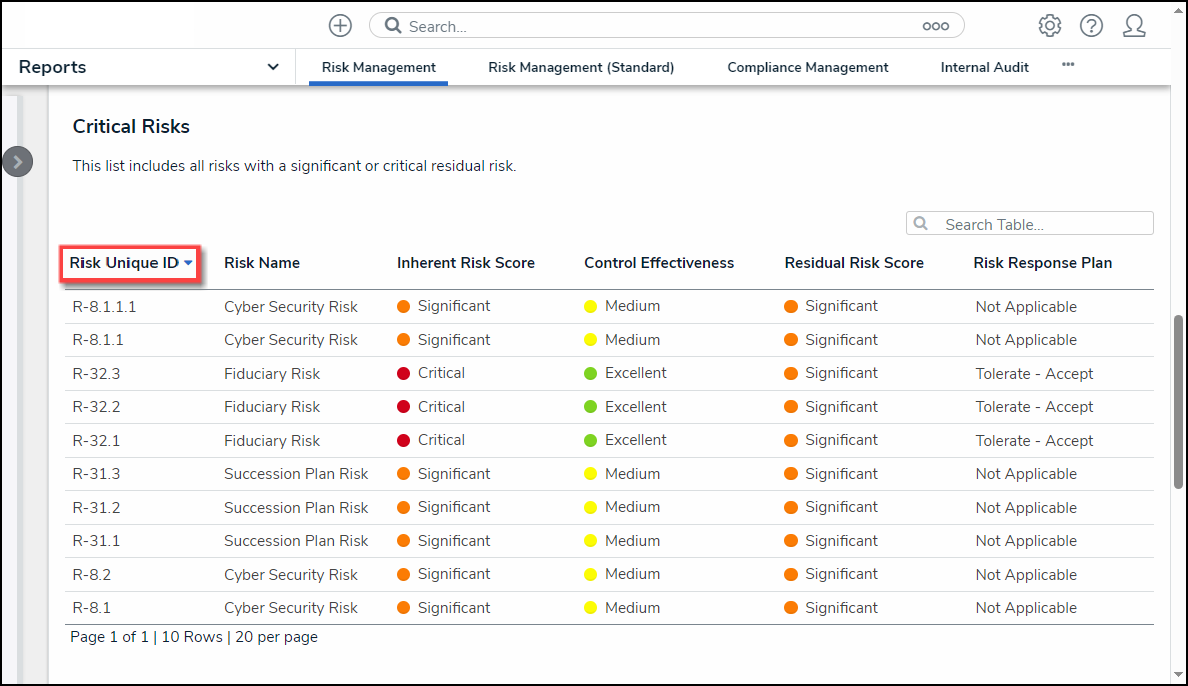
- Click a Column Header to sort the table by ascending (arrow icon up) or descending (arrow icon down) order based on the column's value.
Sort by Column
- Click the Next and Previous icons to scroll through additional table pages if the table has multiple pages.
- Click the Search icon and enter a keyword to narrow the data results listed within the table.
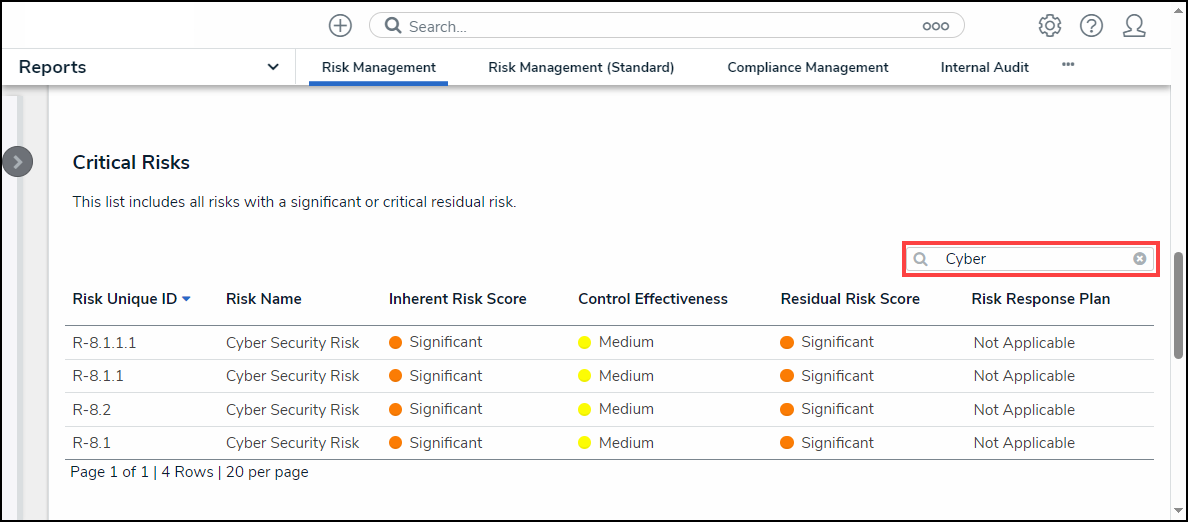
Search Field
- Click the Refresh icon in the Toolbar at the top of the screen to refresh the report data. Please refer to the Loading & Caching Report Data article for more information on refreshing and reloading report data.
![]()
Refresh Icon
Starred Reports
- Click the Star icon in the Toolbar at the top of the screen.
![]()
Star Icon
- From the Add Report to Home screen, click the Label Report field to enter a custom report label or leave the field alone to use the default label.
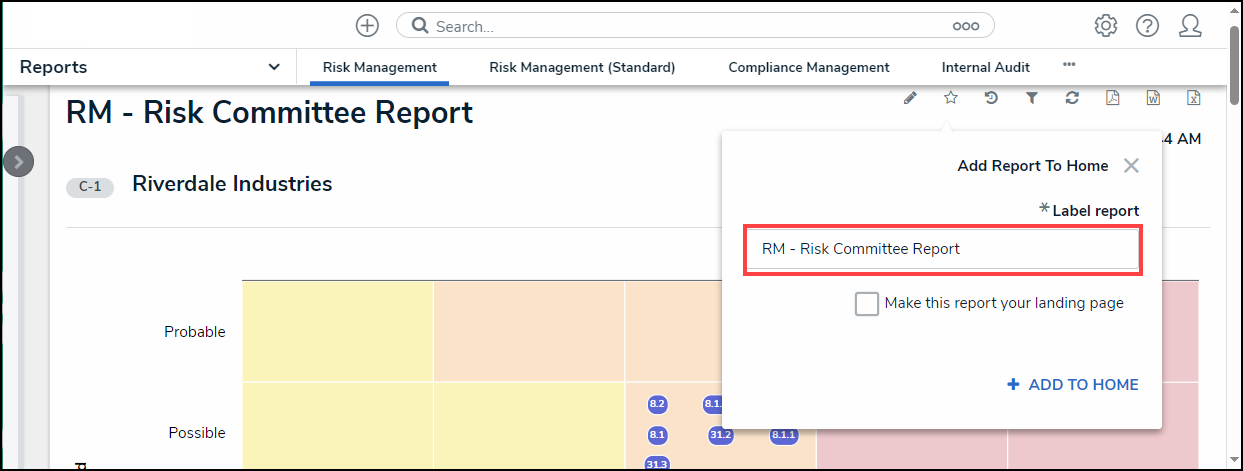
Add Report to Home Screen
- Click the Make this report your landing page checkbox to have the report open when you first log in, replacing the Home screen.
Report Home Screen
- Click the + Add to Home link to add the report to your My Task list or to add the report as the new Home screen.
- Click the highlighted Star icon.
![]()
Highlighted Star Icon
- From the + Add to Home screen, click the Remove from Home button to remove the report from the Home screen.
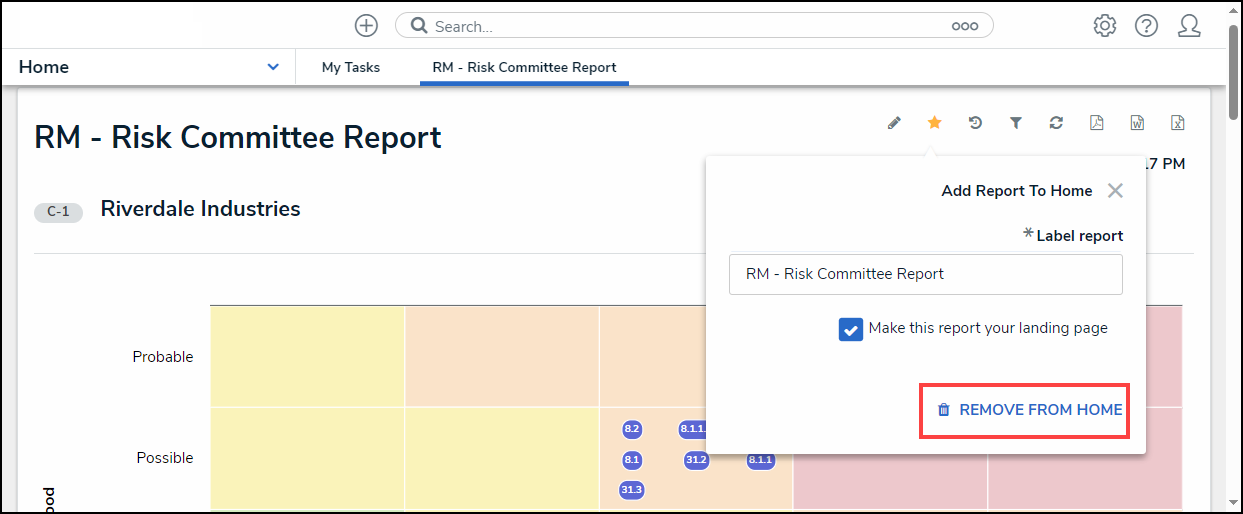
Remove from Home button
Historical Data (Point in Time Reporting)
- Click the Historical Data icon in the Toolbar at the top of the screen.
![]()
Historical Data Icon
 Note:
Note:
If Point in Time Reporting has not been enabled for this report, the Historical Data icon will not be visible.
- From the Point in Time Reporting screen, click the Report Date field and select a report date from the Calendar pop-up.
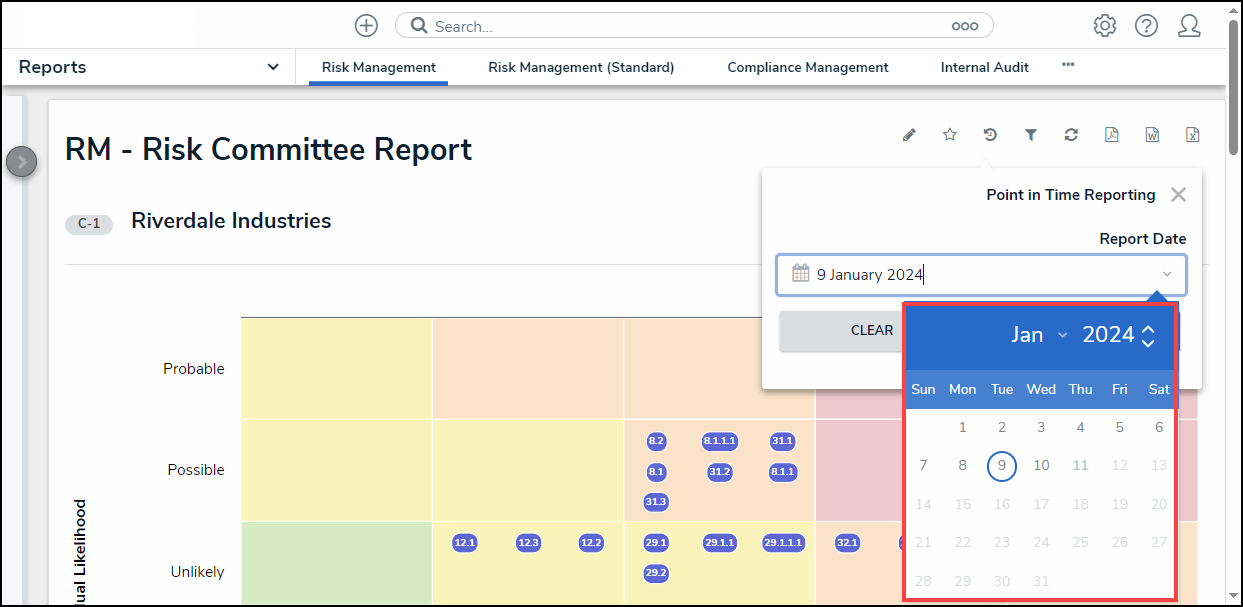
Calendar Pop-up
- Click the Apply button to refresh the report with the historical data based on the Date selected from the Calendar pop-up.
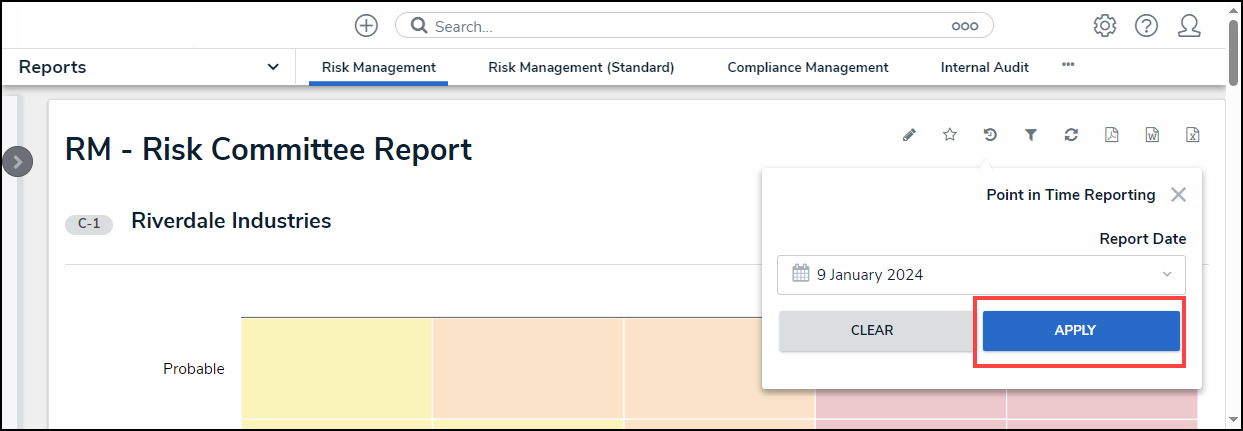
Apply Button
Filters
The Filters icon will appear if configured by an Administrator.
- Click the Filter icon in the Toolbar at the top of the screen.
![]()
Filter Icon
- From the Filter pop-up, apply any of the following filters to narrow the data that appears on the report:
- State: Allows users to filter the table data by object workflow states (e.g., Creation, Draft, Active, and Archived).
- Role: Allows users to filter the table data by user roles granted direct access to objects from the report's data definition.
- Date & Time: Allows users to filter the table data by date and time values. If the field is configured to collect the date and time, the report is filtered based on the current user's time zone.
- Select List: Allows a user to filter table data by select list values (e.g., Low, Medium, High).
- Formula: Allows a user to filter table data by formula labels.
- Relationship/Reference: Allows a user to filter table data by one or more object type relationship or references. For example, selecting the Risk 1 object type in this filter will also display all the Control objects that Risk 1 appears on through a relationship.
- Object Type: Allow a user to filter table data by object type.
 Note:
Note:
Sections may be blank if these filter types have not been added to the report by an administrator.
Filter Pop-up
- Click the Apply Filter button to apply any selected filters to the table data.
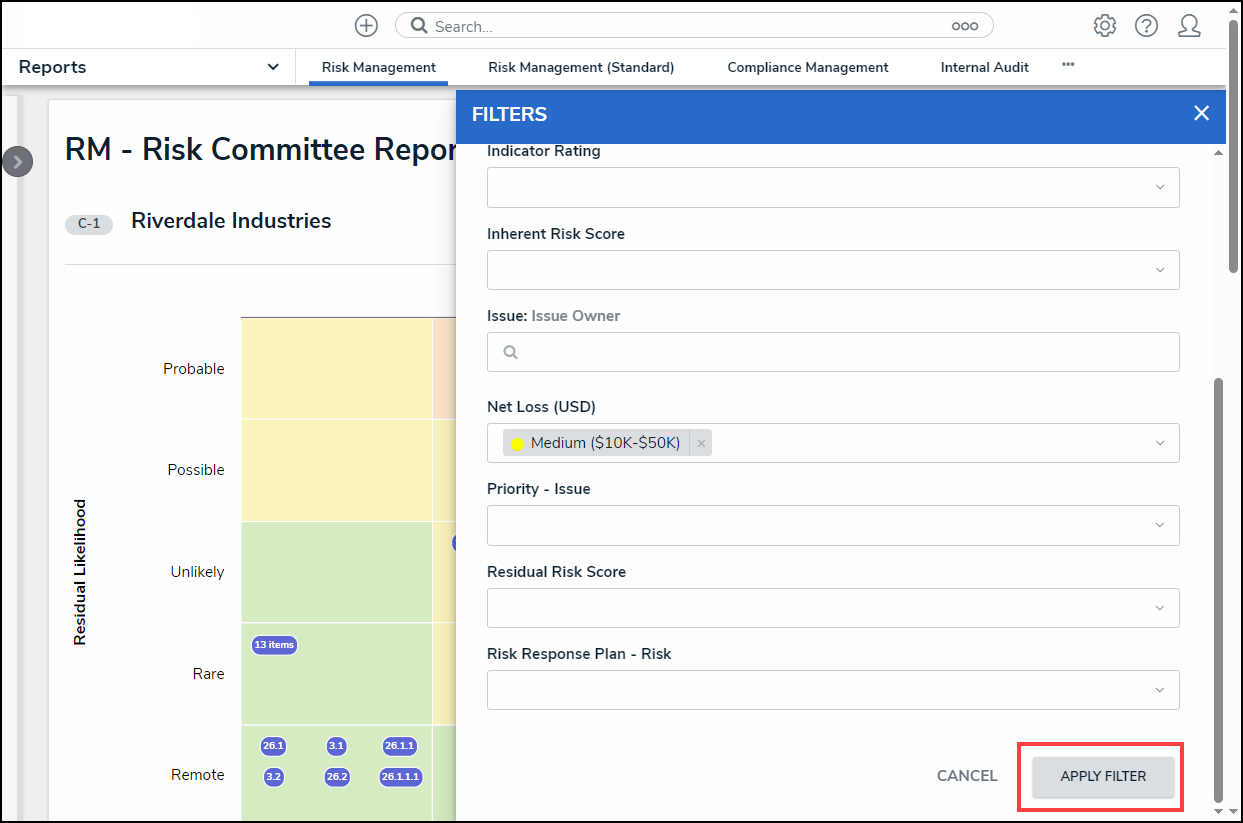
Apply Filter Button
- The Filter icon will appear blue, indicating that there are filters applied to the table data.
![]()
Filter Icon
- Click the x beside a filter to remove the filter. If the filter is date-based, select the field and use the Delete or Backspace key to delete the dates from the fields.
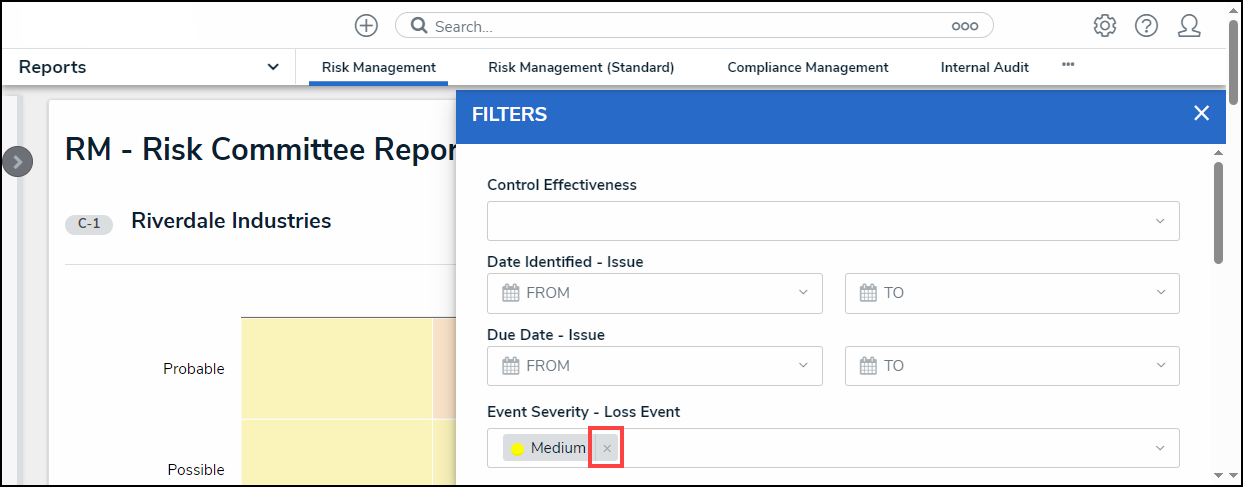
Removing a Filter
- Click Apply Filter to save your changes.
A data grid allows users to view, edit, and analyze object data in a spreadsheet-style format. Users with permission to view a data grid can interact with it by:
- Resizing, sorting, and showing or hiding columns;
- Editing an object's properties (Name and Description) or fields (Text, Numeric, Date & Time, and Select List) within individual cells (if Edit permissions have been enabled on your role and in the data grid settings);
- Viewing an object's details in a palette (if enabled);
- Filtering data by state, role, relationship, reference, or single select list;
- Wrapping or unwrapping cell contents; and
- Moving forward or back through the grid's pages or adjusting the number of rows displayed on a single page.
| Refreshing your browser or navigating away from a data grid will reset any custom display settings (show/hide columns, column width, sorting, etc.) to its default configurations. |
This article provides information and instructions on accessing, viewing, and editing data in a data grid from a view. For information on creating a data grid, see the Create a New Data Grid article.
 A data grid as it appears to end-users in a view.
To view a data grid:
- Navigate to the application and activity where the data grid is saved.
- Click an anchor (root) object in the view to display the data grid.
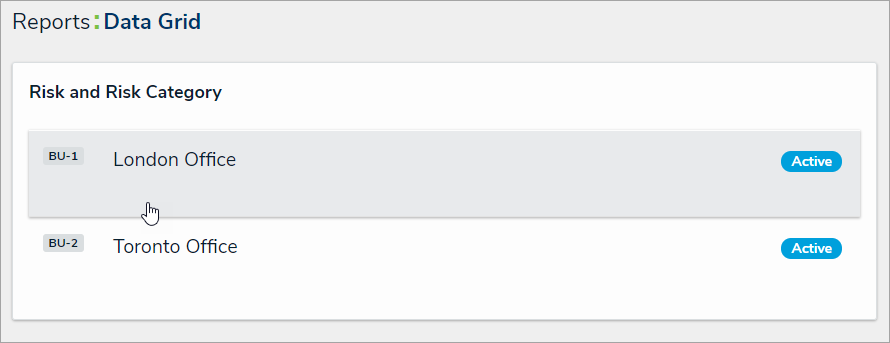 Clicking on an anchor object to view a data grid.
- To open a grid object in a palette, hover your cursor over a cell in the Name column, then click the
 icon. This icon will only appear if the palette option was enabled by an administrator and if the Name column is displayed on the grid.
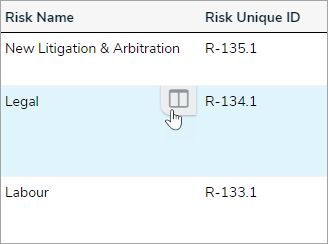 The palette icon in the Name column.
- To edit property (Name or Description) or field data (Plain Text, Numeric, Date & Time, or Select List) in a column that has not been marked as read-only, click the cell, then type your changes or make a selection from the available options. Changes made to cells are applied to the associated object and are saved automatically.
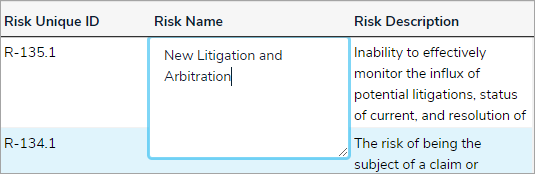 Clicking a cell to edit it. If the cell has been marked as read-only or your role does not have permission to edit the associated object, the cell cannot be edited.
- To edit a text field with rich text formatting enabled, click the cell to open the RTF editor, type your changes, then click the
 icon to save. If you don't have permission to edit the RTF field, clicking it will display the fields' contents in focused mode. Click x to close the RTF editor or window and return to the data grid.
 - To adjust a column's width, hover your cursor over the top of the column to show the
 icon, then click and drag the column to resize it.
 - To sort the grid by column, click the column name at the top of the grid to sort the data alphabetically in ascending order. Click the column name again to sort in descending order. Clicking the column name a third time will remove any sorting.
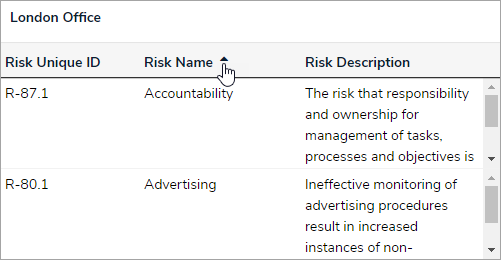 Sorting the columns in a grid.
- To display a specific grid page, click the < or > icons to move forward or back, click the textbox and type the page number you wish to view, or click the arrows, then click away from the text box to reload the grid. To adjust the number of rows displayed, select an option from the row dropdown menu.
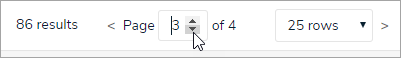 Changing the grid page.
- To configure the grid's display, click the
 icon in the top-right corner of the page. To show or hide columns, select or deselect the column checkboxes. Select the Wrap Cells or Overflow Cells options to wrap or unwrap the data. Select the Display colored cells as ovals checkbox to show formula or select list cells as text with colored circles instead of a full background color. This option does not apply to workflow states.
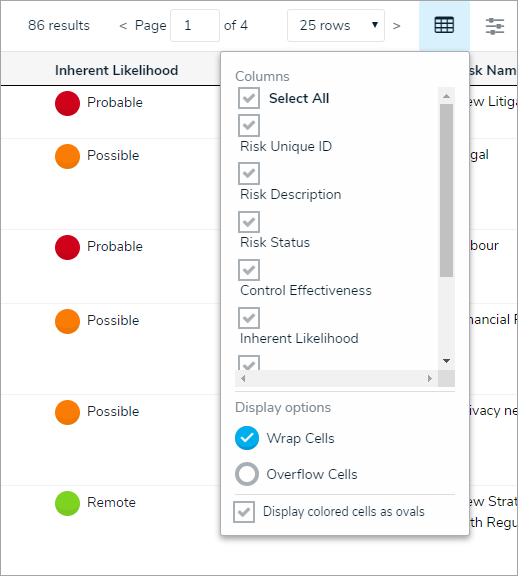 The grid's display options.
- To filter the data displayed in a column by single select list, date, workflow state, formula range, relationship/reference, or role, click the
 icon to the far right of the page to enable filters below the column headers, then begin typing keywords or select an option. Click the
  icon again to disable/reset any filters.
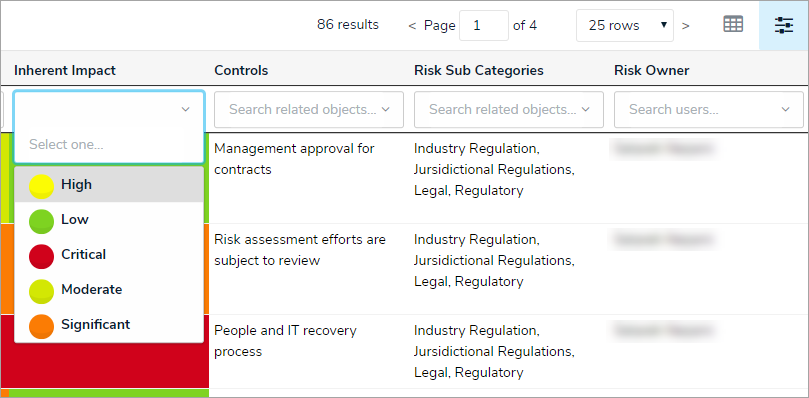 Filtering the data displayed in the grid.
- To reset any custom display settings, including filters, column widths, hidden columns, page numbers, or rows, refresh your browser.

 icon. This icon will only appear if the palette option was

 icon to save. If you don't have permission to edit the RTF field, clicking it will display the fields' contents in focused mode. Click x to close the RTF editor or window and return to the data grid.
 icon, then click and drag the column to resize it.

 icon in the top-right corner of the page. To show or hide columns, select or deselect the column checkboxes. Select the Wrap Cells or Overflow Cells options to wrap or unwrap the data. Select the Display colored cells as ovals checkbox to show formula or select list cells as text with colored circles instead of a full background color. This option does not apply to workflow states.
 icon to the far right of the page to enable filters below the column headers, then begin typing keywords or select an option. Click the
  icon again to disable/reset any filters.
Overview
Report data can be exported into downloadable PDF, Word document, and spreadsheet files. However, there are some restrictions, depending on the file format and element type. All links and file attachments are disabled in exported report files.
Reports display the time and date the report was last updated/loaded based on the current user's local timezone. This timestamp appears on exported files and is updated when the report is reloaded or refreshed. To ensure your exported report files reflect the most recent data, click the Refresh icon on the report or refresh your browser before exporting. See the Loading & Caching Report Data article for more information.
 Note:
Note:
Data grids cannot be exported.
Related Information/Setup
Please refer to the Create a New Report article for more information on creating reports.
Navigation
- From the Home screen, click the Home dropdown.

Home Dropdown
- From the Home dropdown, select the Reports application.
Reports Application

- From the list of reports, click the report that you want to export.
Report Name

Exporting a Report as a PDF
Tables, charts, heat maps, repeatable forms, and free form text can be exported into a PDF file. The PDF file will reflect any page breaks or PDF headers added to the report canvas by an administrator.
An Example of a Report Exported as a PDF
- From the report you want to export as a PDF, click the Export to PDF icon.
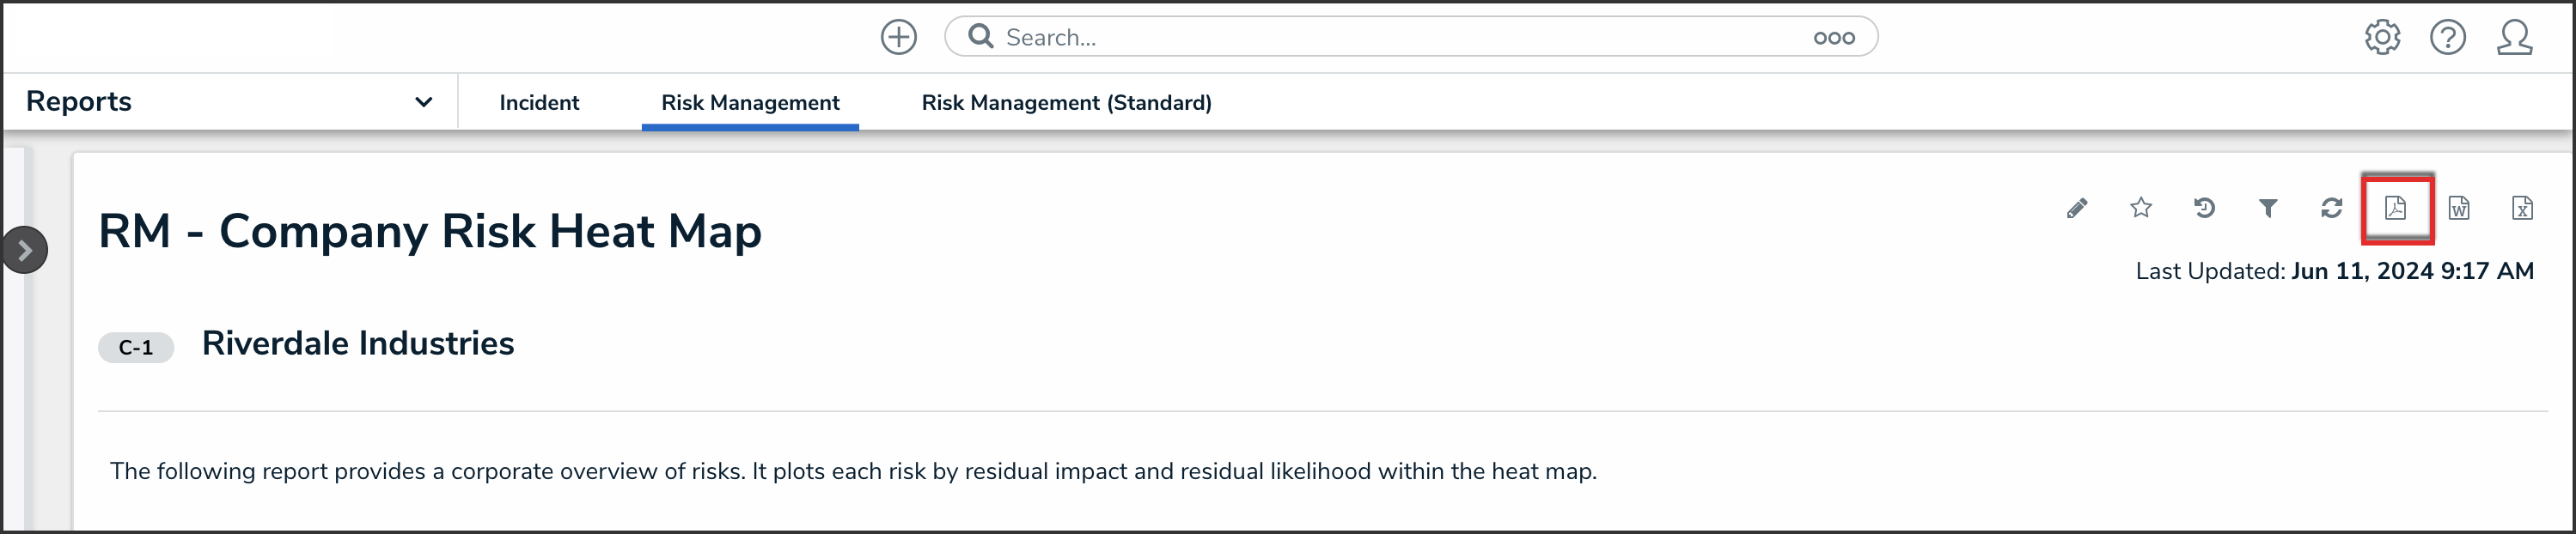
Export to PDF Icon
Exporting a Report as a Word Document
Only table reports can be exported into a Word document. If the report contains other report elements, only the table data will be exported. Repeatable form elements are not displayed in the export.
Note:
Point in time reporting is not currently supported. Exporting a report with historical data currently displayed will generate a file showing present-day data only.
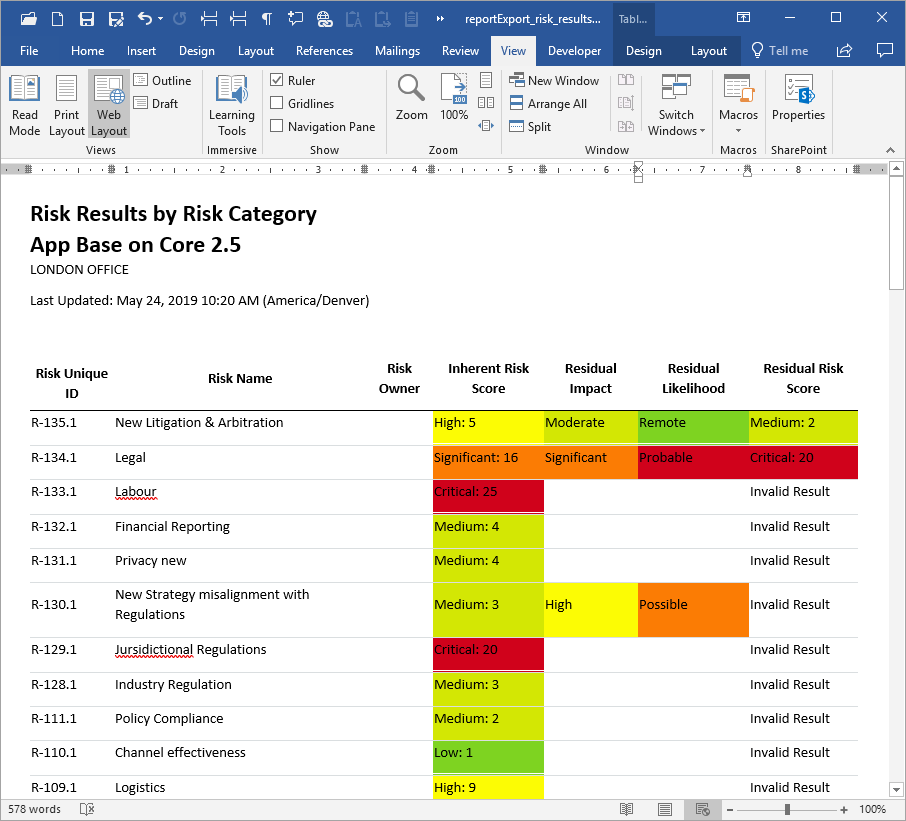
An Example of a Report Exported as a Word Document
- From the report you want to export as a Word document, click the Export to Word icon.
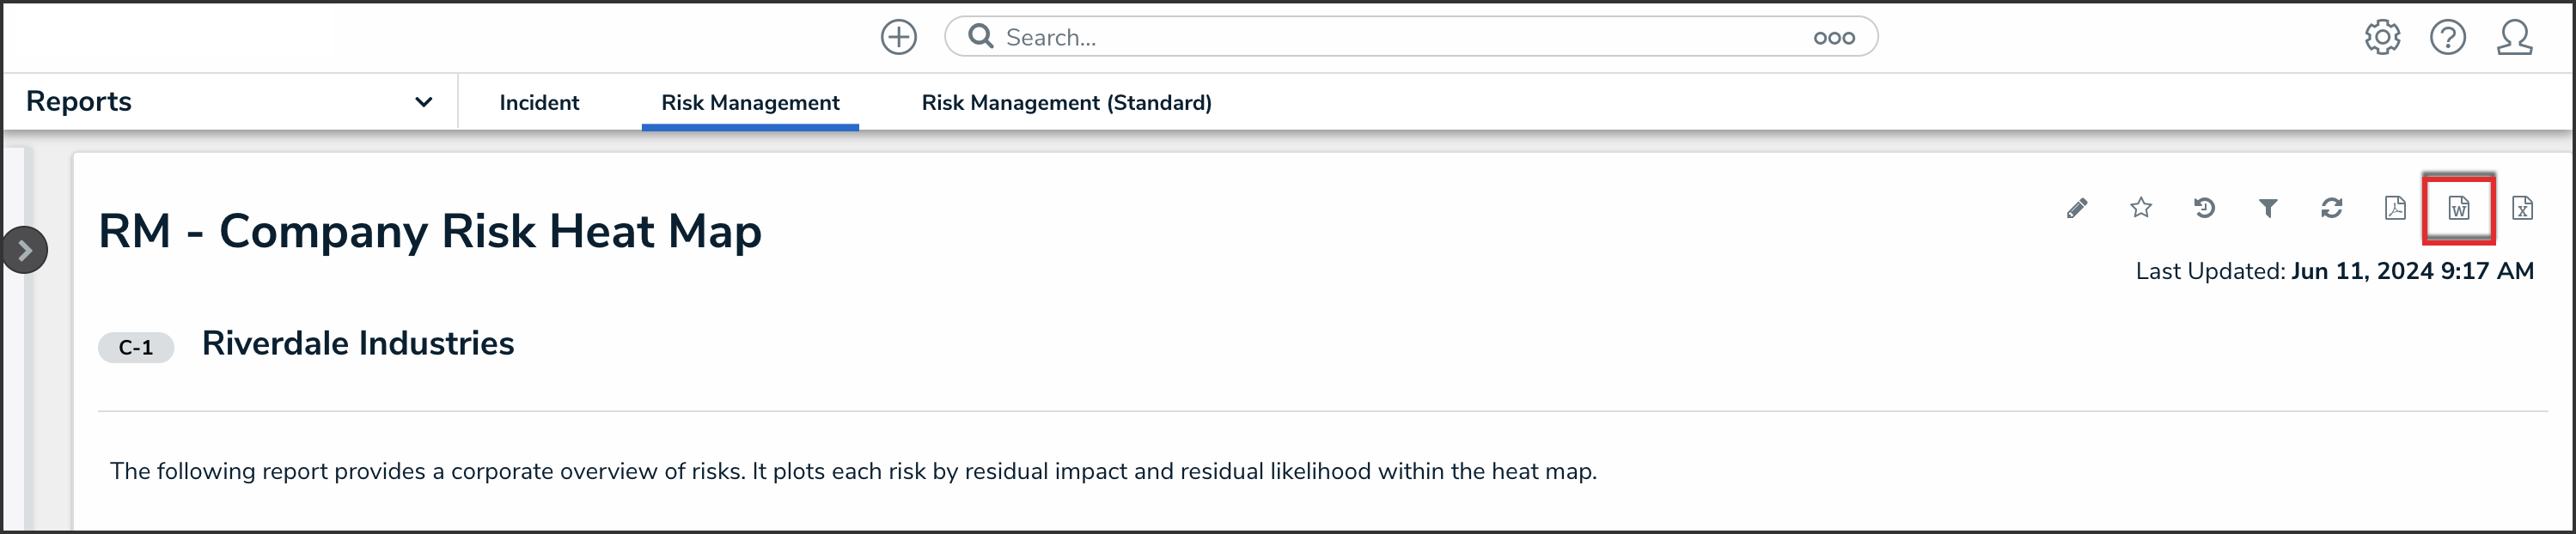
Export to Word Icon
Exporting a Report as an Excel Document
Only table reports can be exported into an Excel document. If the report contains other report elements, only the table data will be exported.
Note:
Point in time reporting is not currently supported. Exporting a report with historical data currently displayed will generate a file showing present-day data only.
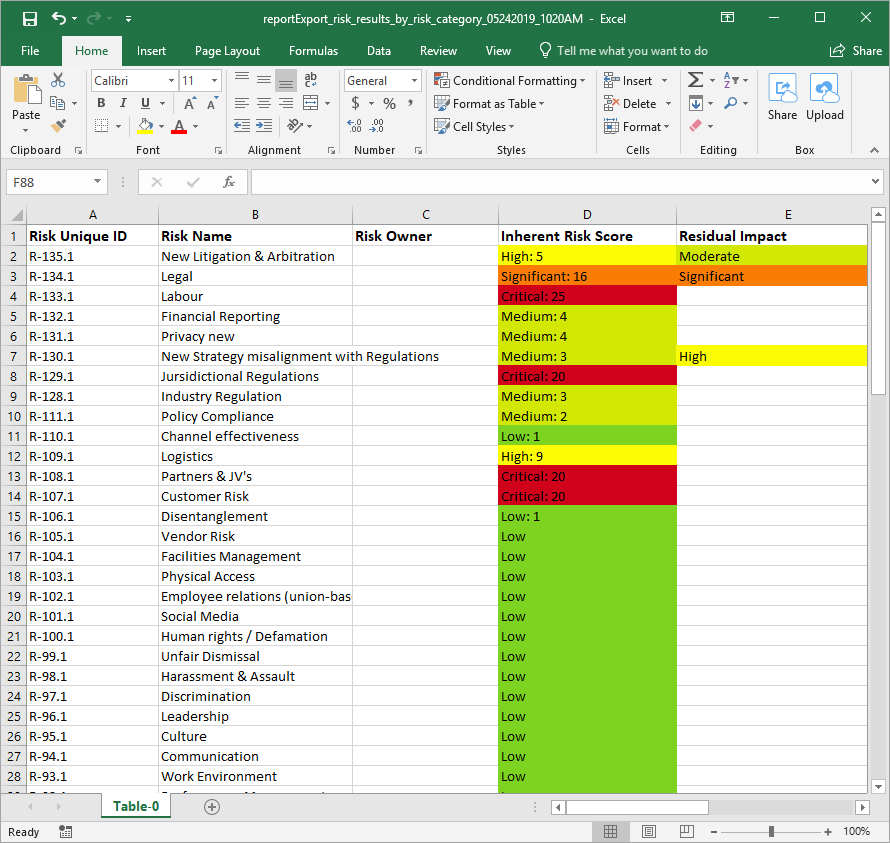
An Example of a Report Exported as an Excel Document
- From the report you want to export as an Excel document, click the Export to Excel icon.
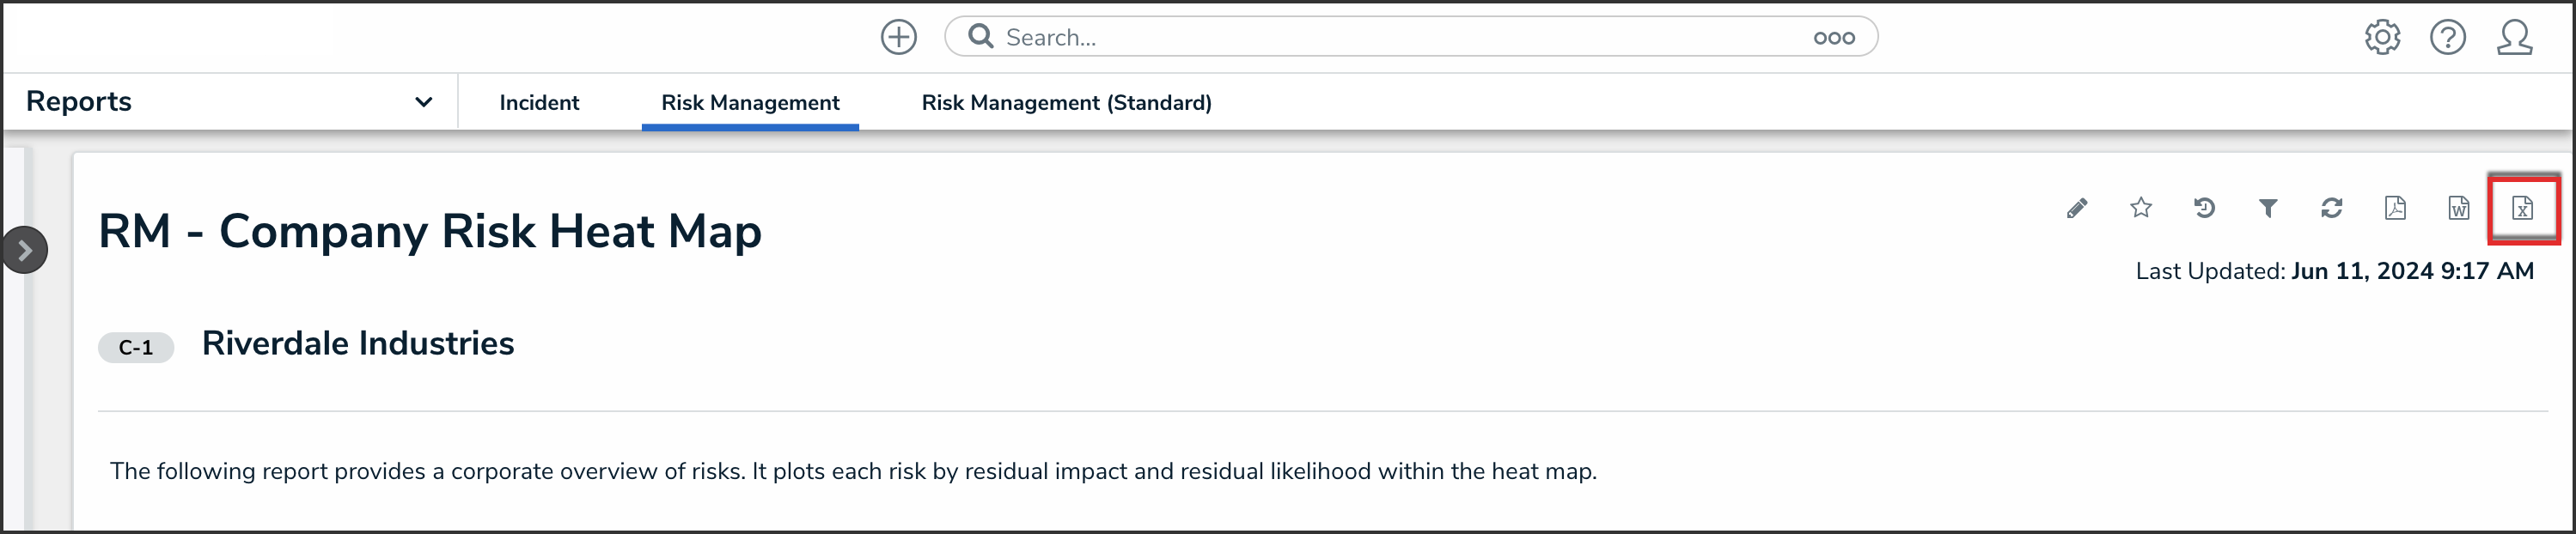
Export to Excel Icon
Attachments are the data series, fields, and relationships of a report that users can export. To ensure that only the most relevant information is exported, administrators can determine which elements of the report can become attachments.
To configure a report's export attachments:
Click the
icon in the top bar > Data Visualizations in the Views section.Click the report you wish to configure the exports for or enter its name in the Search field, then click it to open the Edit Report page.
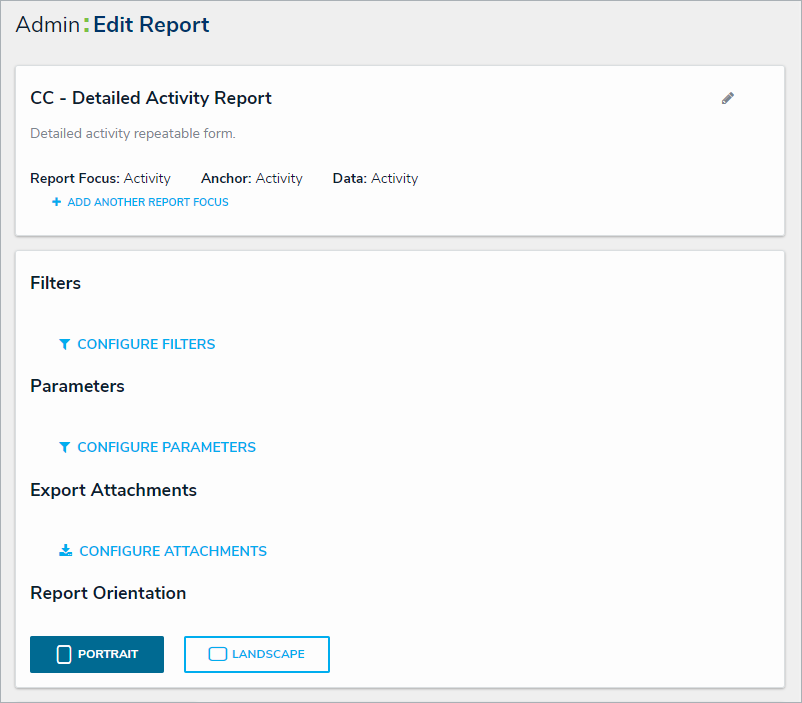 The Admin: Edit Report page.
Click Configure Attachments under Export Attachments to open the Add Attachment Export palette.
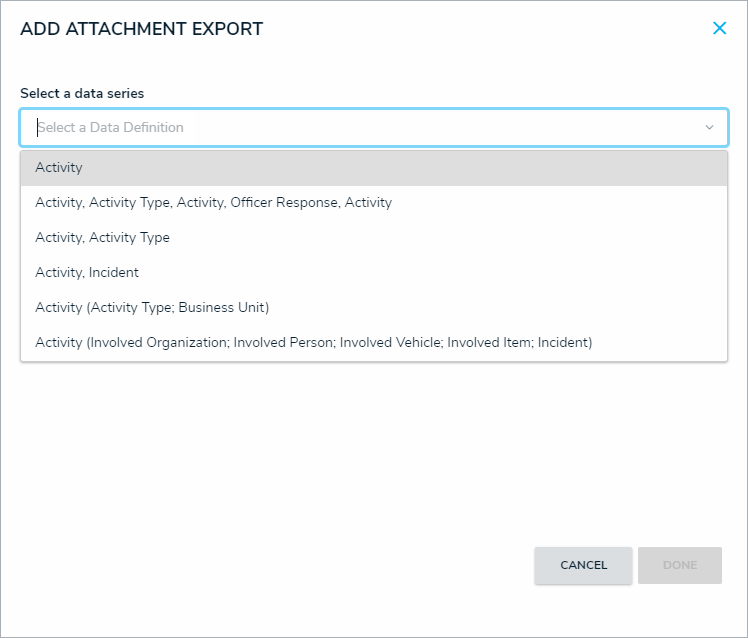 The Add Attachment Export palette.
Select the data series the exports will be coming from in the Select a data series field.
Click Done.
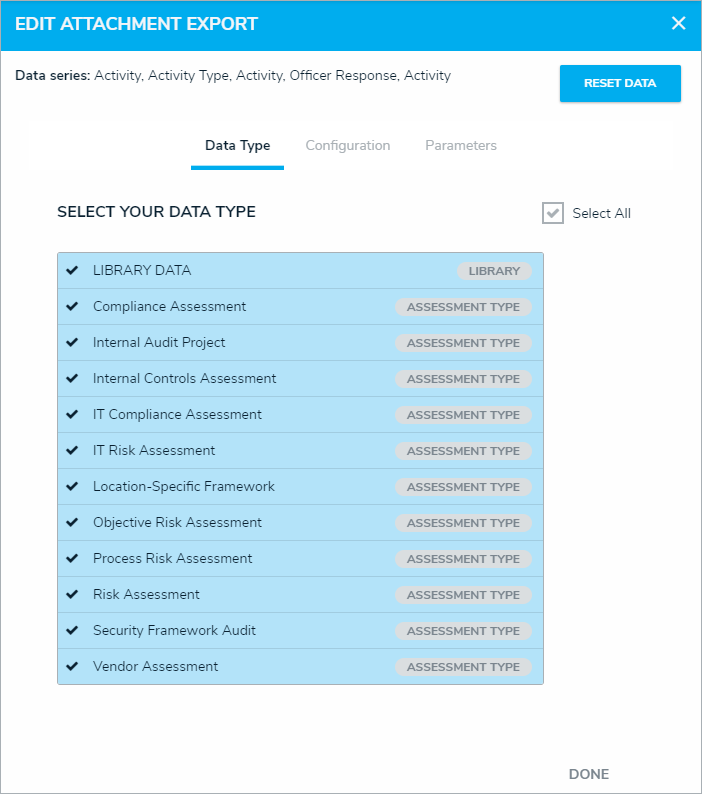
Click Configure Attachments again to open the Edit Attachment Export palette.
In the Data Type tab, select the type of data you wish to include in the export. All data types are selected by default.
 The Data Type tab.
In the Configuration tab:
Choose the relationship from the Select a Relationship select list.
Begin typing the name of the field you wish to add to the export in the Select Fields field and select it to add it to the export. More than one field can be added.
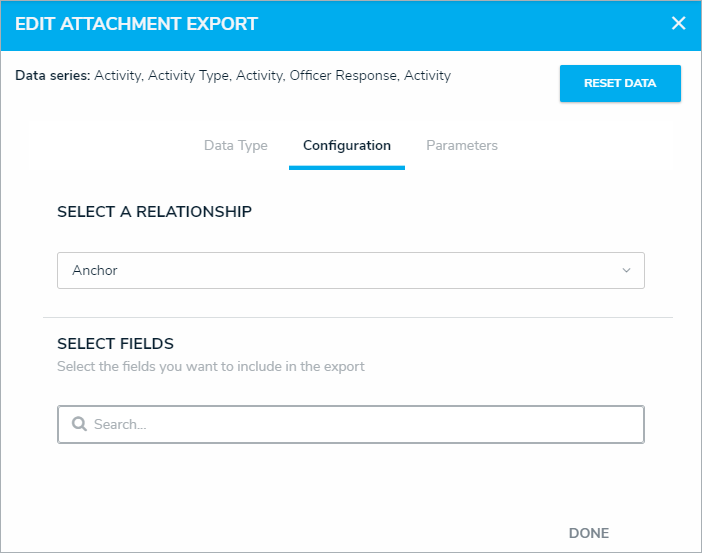 The Configuration tab.
In the Parameters tab, select how the information in the export will be filtered with any of the select lists in the Define Parameters section.
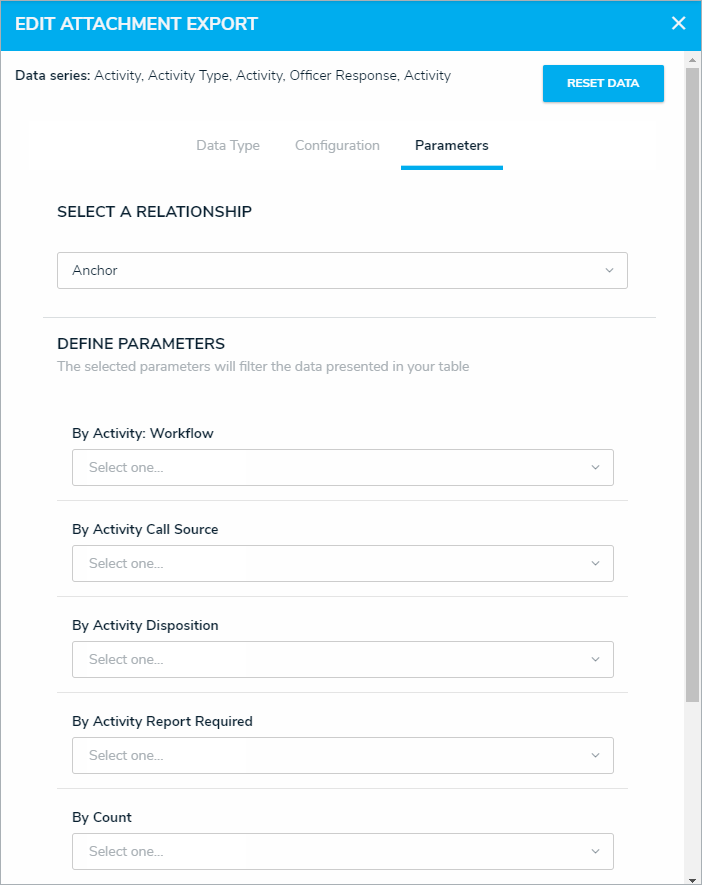 The Parameters tab.
Click Done.


