When creating a new report, you must create the report container (instructions below), select an anchor, then create one or more data definitions. Note that reports created prior to Version 3.0 are configured to display archived data by default. Reports created after Version 3.0 are configured to exclude archived data by default. See the Data Analytics Export Report or Data Grid sections for information on creating an export report or data grid.
 | This article provides instructions for creating a report container. After you've completed these steps, you'll need to add one or more element (chart, table, heatmap, etc.) to display data in the report, then add the report to a view to make it available to end-users. See the Report Elements section and Create a Report View article for more information. |
To create a new report:
- Ensure the data definitions you intend to use for the report focus and data series have been created from the Data Definitions settings in the administrative settings.
- Click the
 icon in the top bar > Data Visualizations in the Views section.
 - Click Create Data Visualization.
- Enter the name of the report in the Name field.
- Optional: Enter a description of the report. This description will appear below the report’s name on the Data Visualization page.
- Select Report from the Type dropdown menu. If you're creating a data analytics export or data grid, see the Create a Data Analytics Export Report or Create a New Data Grid articles for more information.
- Select a report focus from the Focus dropdown menu. For example, if you wish to
create a report that displays data on the risks and controls at each location in your company, you would select a report focus with the Location object type as your anchor and no other object types (leaves) selected.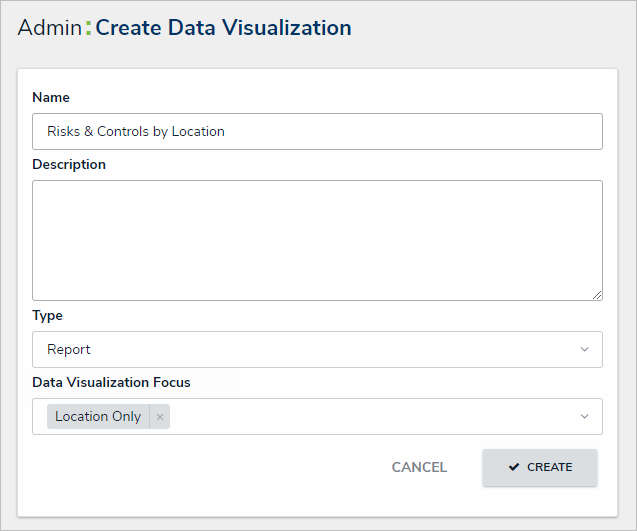 The Create Data Visualization page.
 - Optional: Select additional, related report focus definitions from the Focus dropdown menu. Selecting another report focus will provide more data series options to choose from when adding a report element (table, chart, heat map, or repeatable form).
- Click Create to display the Edit Report page.
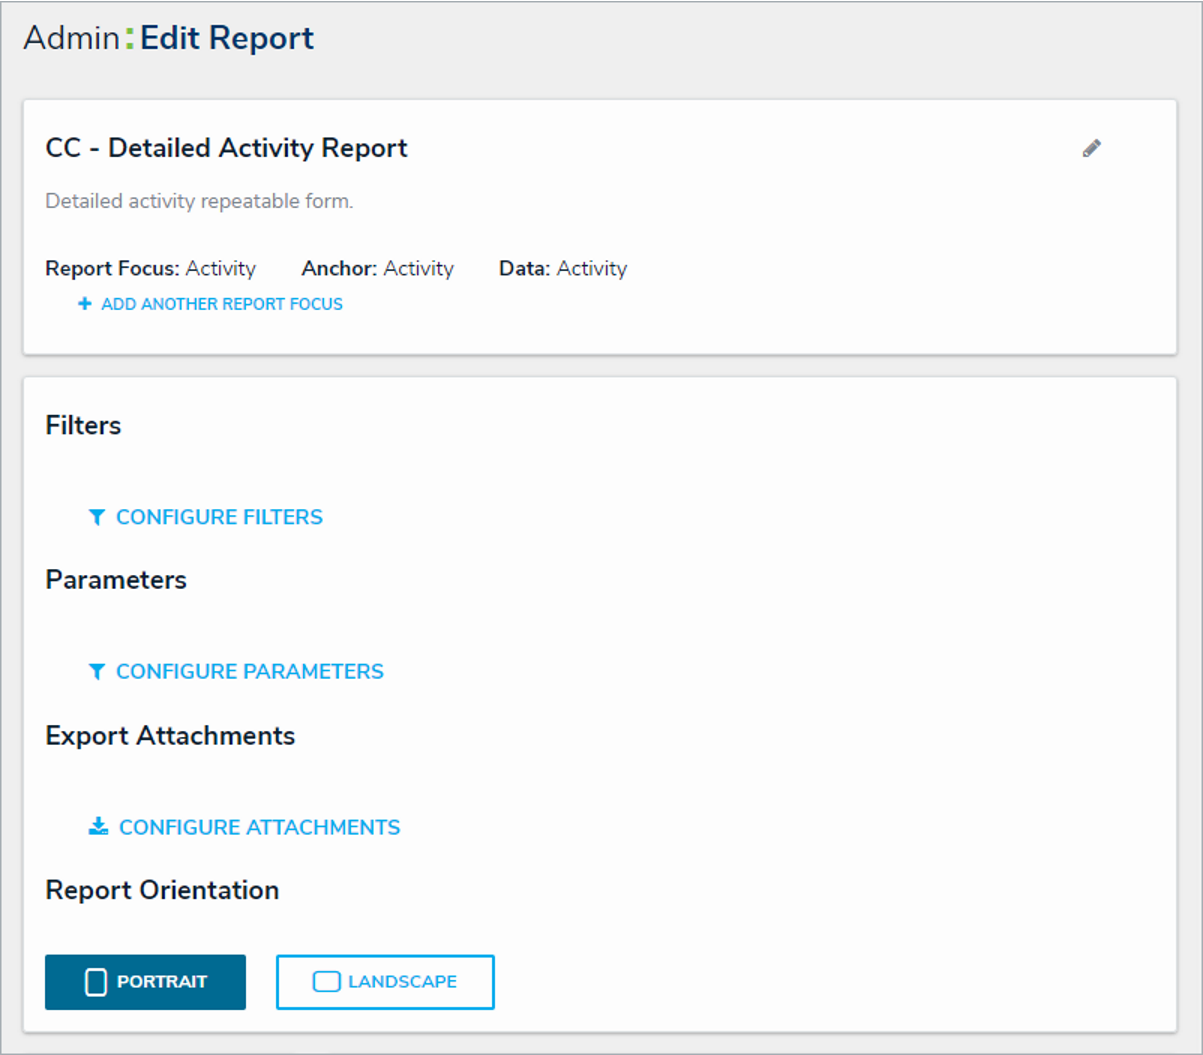 The Admin: Edit Report page.
 - Optional: To edit the report name or add a description, click the
 icon at the top-right of the first section on the page.
 - Optional: To include or exclude archived data, click theicon, then select or deselect the Include archived data in report checkbox. When selected, the report elements will display data from objects that are currently in an archived state. See the Archived Data section for more details.
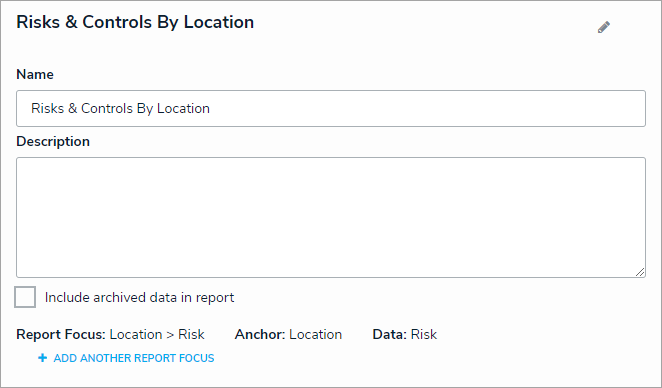 View of Risks & Controls by Location.
 - Optional: Click Add Another Report Focus to include another report focus definition. Depending on the data path, selecting another report focus will provide more data series options to choose from when adding a report element (table, chart, heat map, or repeatable form).
 icon in the top bar > Data Visualizations in the Views section.

 icon at the top-right of the first section on the page.
Once you’ve created the report and selected one or more report focus definitions, you can add charts, tables, heat maps, or repeatable forms, filters, parameters, or text. Reports can then be accessed in an activity by adding it to a report view.