Overview
An Administrator or Data Management advanced permissions user can create a new Data Analytics Export report. Data Analytics Export reports are data visualizations that are specifically designed to allow end users to export object data (properties, fields, workflow states, relationships, and references) into an Excel spreadsheet.
User Account Requirements
The user account used to log into Resolver must have Administrator permission or Data Management advanced permissions to create a Data Analytics Export Report.
Related Information/Setup
Please refer to the Add a View to an Activity article for more information on adding a Data Analytics Export report to a View.
Please refer to the Add an Action to an Activity in Resolver Core article for more information on adding a Data Analytics Export report to an Action.
Please refer to the Export Data Action on Forms in Resolver Core article for more information on adding a Data Analytics Export report to Export Data.
Navigation
- From the Home screen, click on the Administration icon.
![]()
Administration Icon
- From the Administrator Settings menu, click Admin Overview.

Administrator Settings Menu
- From the Admin: Overview screen, click the Data Visualizations tile under the Views section.
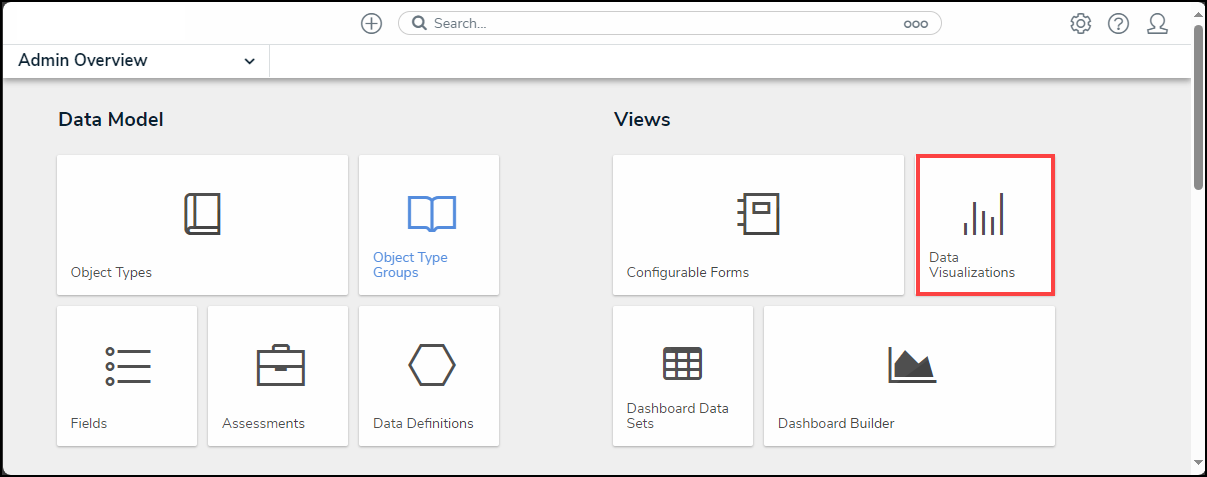
Data Visualizations Tile
- From the Admin: Data Visualizations screen, click the + Create Data Visualizations button.

+ Create Data Visualizations Button
Creating a Data Analytics Export Report
Ensure the data definition you wish to use for the data analytics report has been created from the Data Definitions settings in Administration.
- From the Admin: Create Data Visualization screen, enter a report name in the Name field. The name will represent the report throughout the system.

Name Field
- (Optional) Enter a brief description of the Data Analytics Export in the Description field. The description will appear below the Data Analytics Export's name on the Admin: Data Visualization screen.

Description Field
- Click the Type field and select Data Analytics Export from the dropdown menu.

Type Dropdown Menu
- Click the Data Visualization Focus field and select a focus from the dropdown menu. Enter the name of the focus in the Data Visualization Focus field to narrow the focus list. A Data Visualization Focus is a data definition that broadly specifies which object type’s data will be displayed in a data visualization.

Data Visualization Focus Field
- Click the Create button to create the Data Visualization Export.

Create Button
- The Admin: Edit Report screen will appear. Once the export report has been created, you can grant end users access to it by adding it to a View, Action, or Export Data form action.

Admin: Edit Report Screen