Overview
Users can display additional information on a table by adding or editing table columns.
User Account Requirements
The user account you use to log in must have Administrator permission to access the Data Visualization feature.
Related Information/Setup
For more information regarding Views, please refer to the Views Over article.
For more information on role permissions, please refer to the Workflow Permissions article.
Navigation
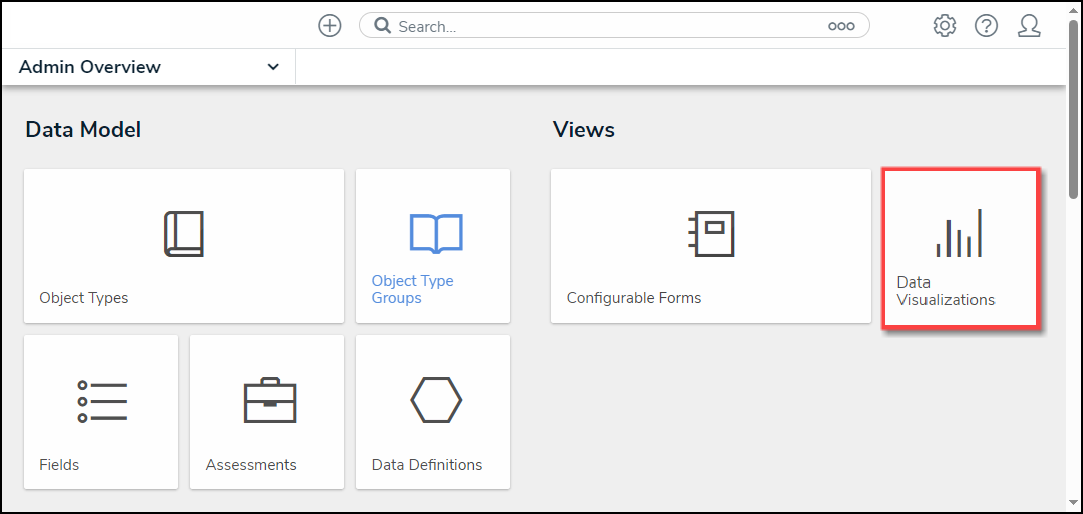
- From the Home screen, click the Administration icon.
![]()
Administration Icon
- From the Admin Overview screen, click the Data Visualizations tile under the Views section.
Data Visualization Tile
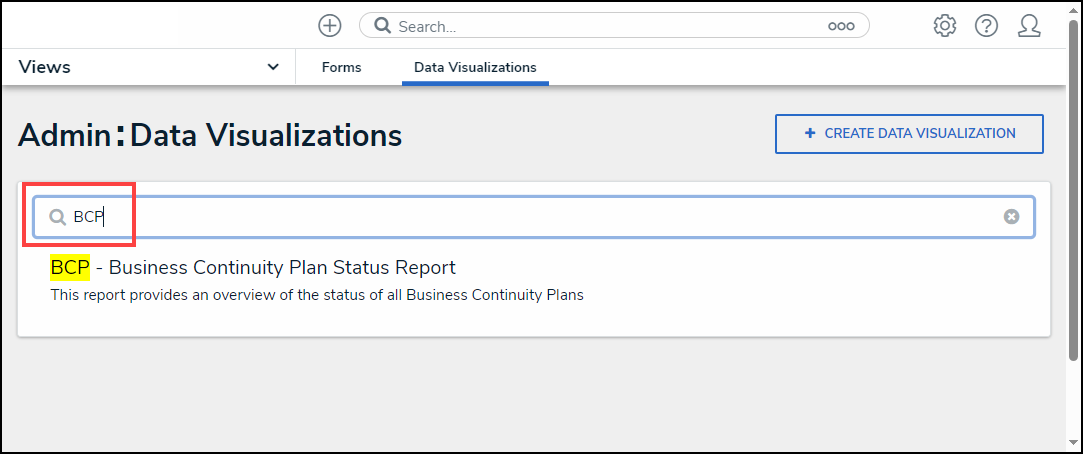
- From the Admin: Data Visualizations screen, enter a keyword in the Search field to narrow the search results list.
Search Field
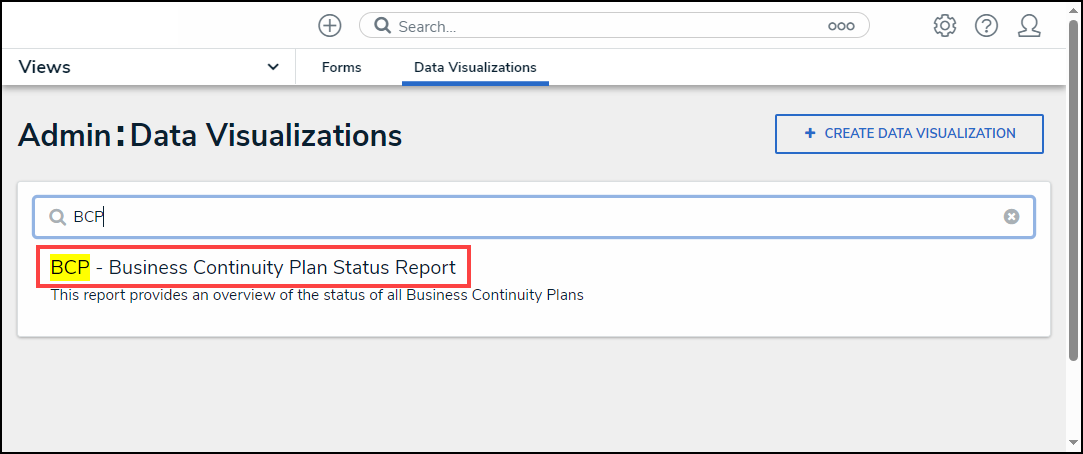
- Click the Report you want to add or edit a column.
Report Link
Edit Columns in a Report Table
- From the Admin: Edit Report screen, navigate to where the table is on the Report.

Table Section
- Hover the cursor over a table and click the Edit icon to edit the table.
![]()
Edit Icon
- From the Edit Table screen, click the Columns tab.

Columns Tab
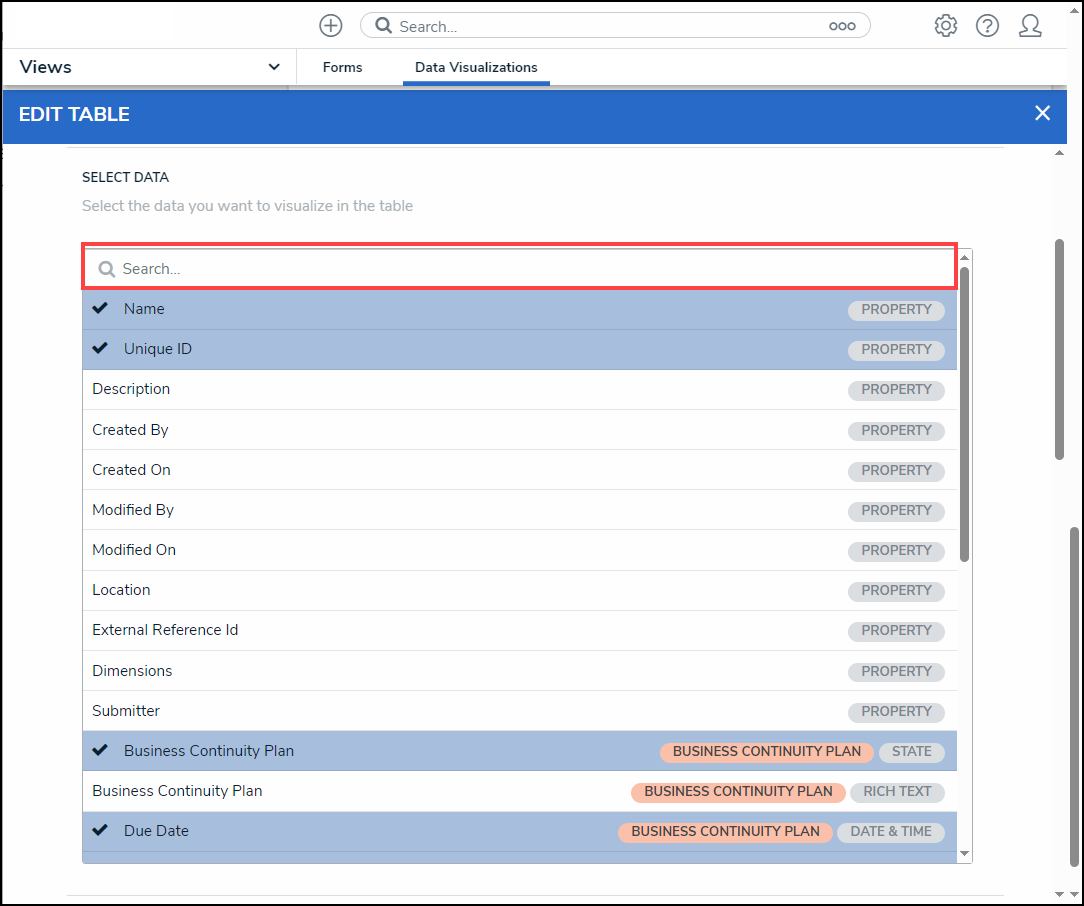
- From the Columns tab, scroll to the Select Data section.

Select Data Section
(Optional) Enter a keyword in the Search field to narrow your search.
Select Data Search Field
Click on a property, workflow state, field, formula, relationship, reference, or role to add the information to the table using a data column.


Select a Column Element
- (Optional) Deselect a column element (field, workflow state, etc.) to remove the column from the table.
- Select a default form from the Default Custom Forms dropdown menu. The form selected will appear when a user clicks on the table data. Choosing Default will display the form on the user's role permissions for the object type.
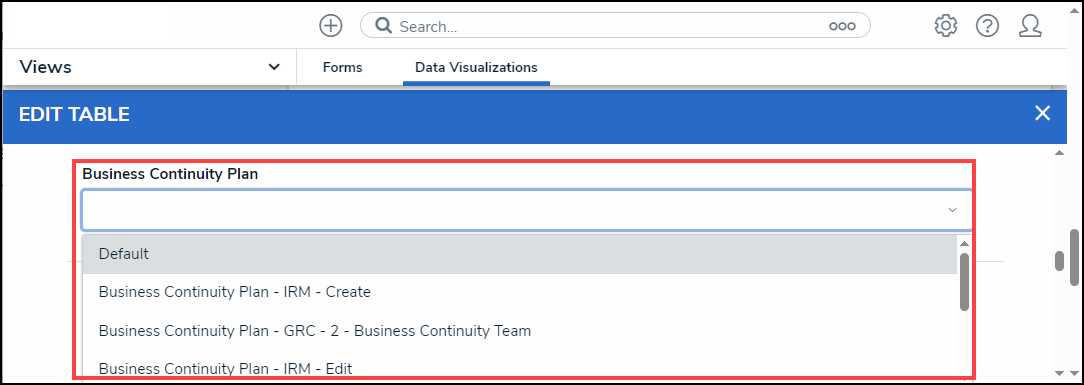
Default Custom Forms Dropdown
- (Optional) From the Sort Columns section, click the Delete icon to remove a column from the table.
![]()
Delete Icon
- (Optional) Click the Move icon to rearrange the columns on the table.
![]()
Move Icon
- (Optional) Select the Show SUM totals for all numeric columns checkbox will display the total value of all numeric fields on the table.
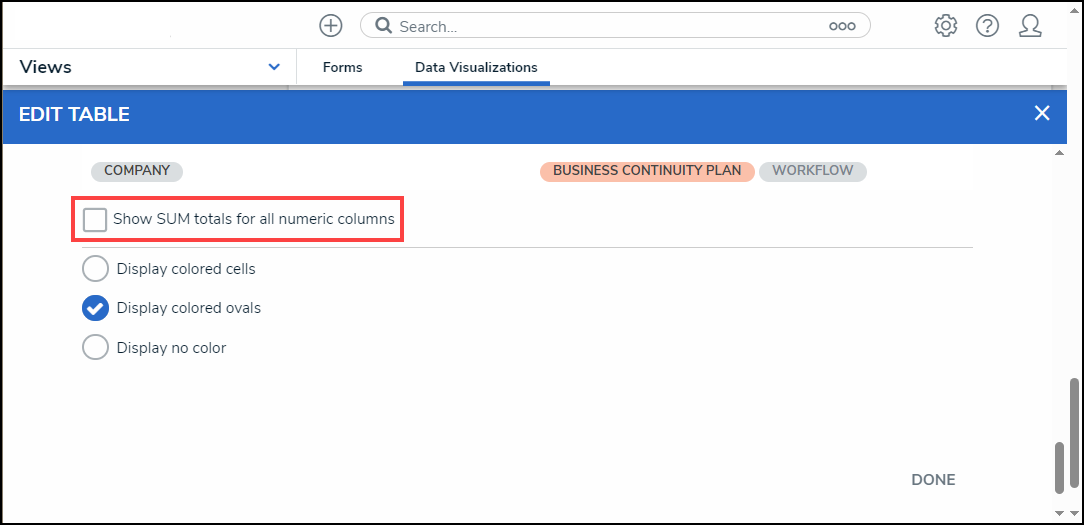
Show SUM total for all numeric columns
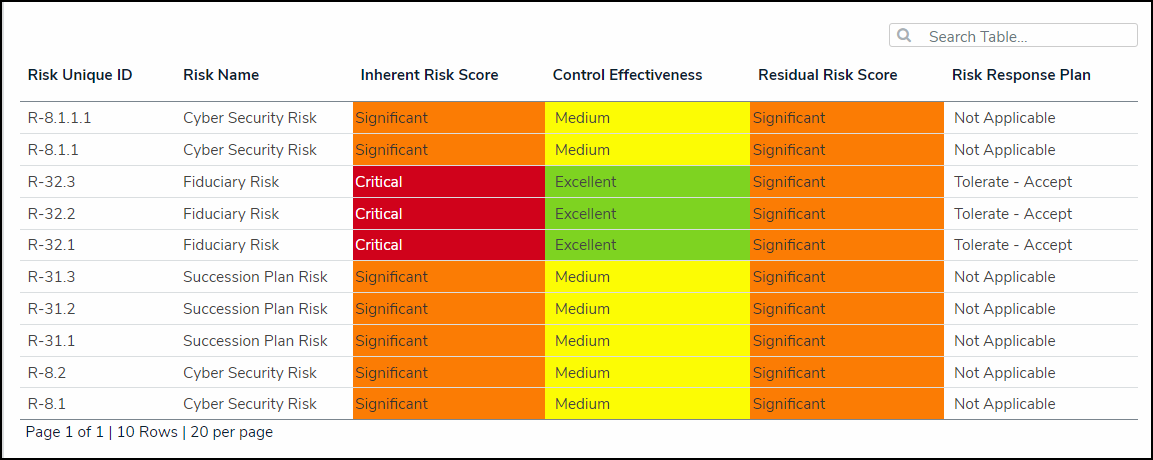
- (Optional) Select the Display Colored Cells checkbox to display formulas or select list cells with text and full background color.
Display Colored Cells
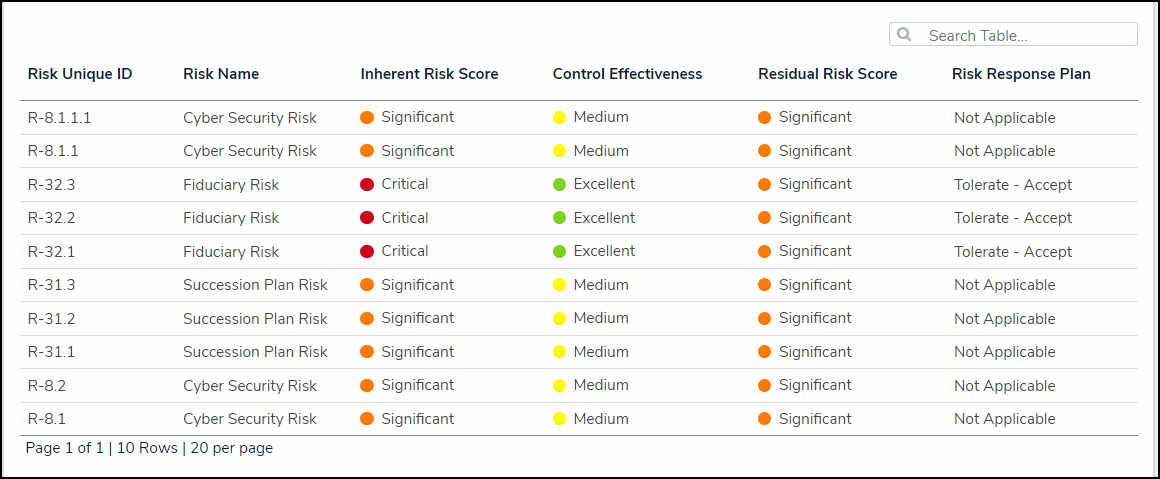
- (Optional) Select the Display Colored Ovals checkbox to display formulas or select list cells as text with colored circle background.
Display Colored Ovals
- (Optional) Select the Display No Color checkbox to display formulas or select list cells as text with no background.
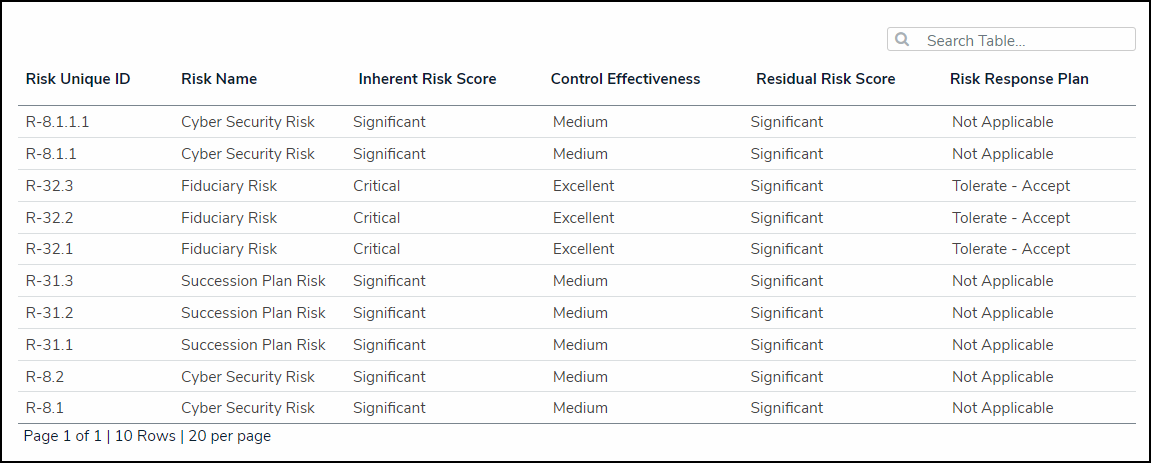
Display No Color
- Click the Done button to apply your changes.
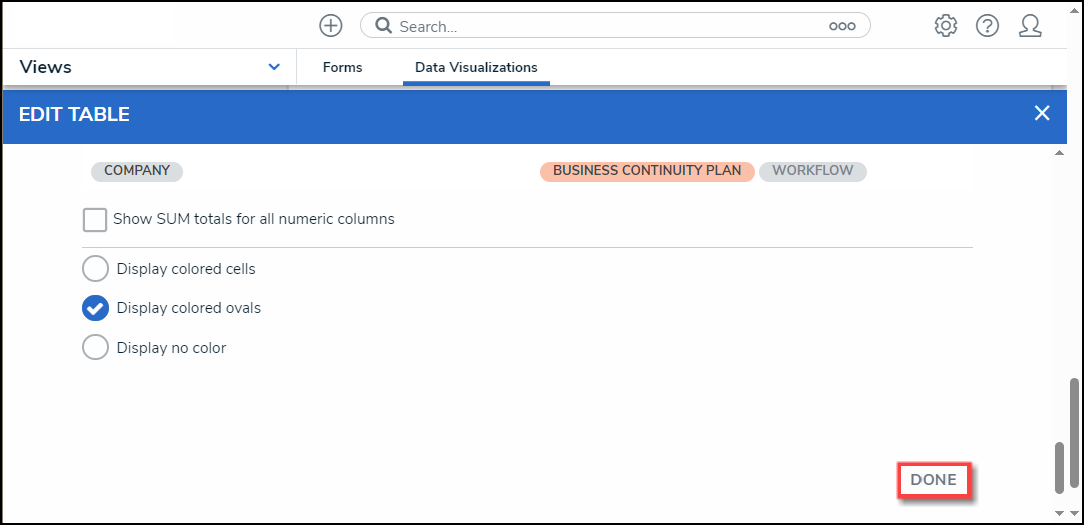
Done Button