Our new Dashboard feature can be scheduled for enablement, for the initial launch phase. Please contact your Customer Success Manager to schedule implementation with our Services team.
Overview
Resolver’s Dashboard Builder allows Administrators to build custom Dashboards using the Dashboard Data Sets published within their Org.
 Warning:
All changes or edits made to a Chart are globally applied across all instances of that Chart. Create a duplicate Chart to apply changes or edits that will not affect the original Chart.
Before using the Dashboards feature, at least one Dashboard Data Set needs to be created and published.
User Account Requirements
The user account you use to log into Resolver must have Administrator permission to use the Dashboard Data Set Builder.
Related Information/Setup
To create a new Dashboard Data Set, please follow the link below:
To add Fields, Formulas and Properties to a Dashboard Data Set, please follow the link below:
- Adding Fields to a Dashboard Data Set
- Adding Formulas to a Dashboard Data Set
- Adding Properties to a Dashboard Data Set
After creating a Dashboard Data Set, the user must publish it before it can be used with the Dashboard Data Set Builder. Please follow the link below for more information on Publishing a Dashboard Data Set.
Navigation
- From the Home screen, click on the System icon.
![]()
System Icon
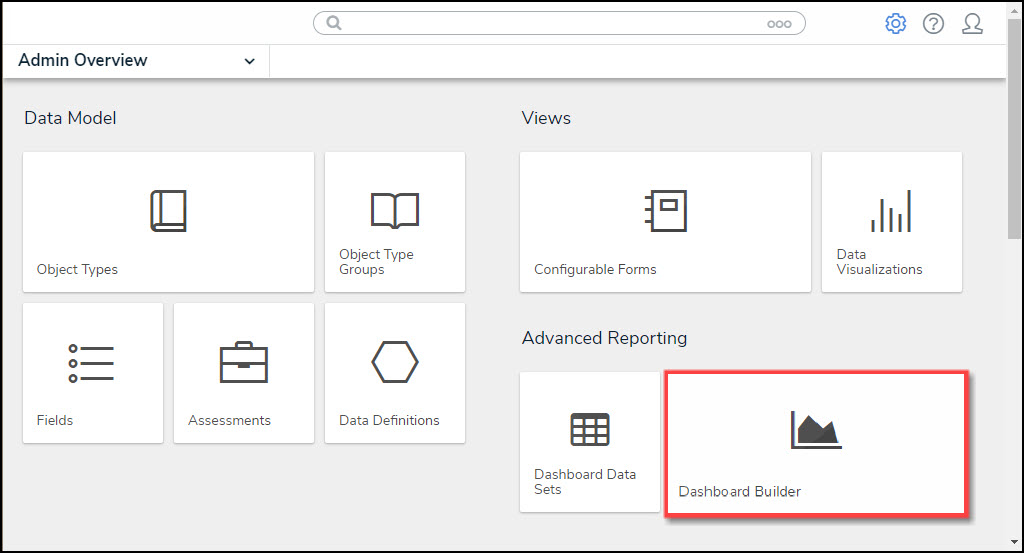
- From the Admin Overview screen, click on the Dashboard Builder tile under the Advanced Reporting section.
Dashboard Data Sets Tile
- From the Dashboard Builder screen, click the + Create Dashboard button. If there are no Dashboards in the system, a + Create Dashboard link will appear.
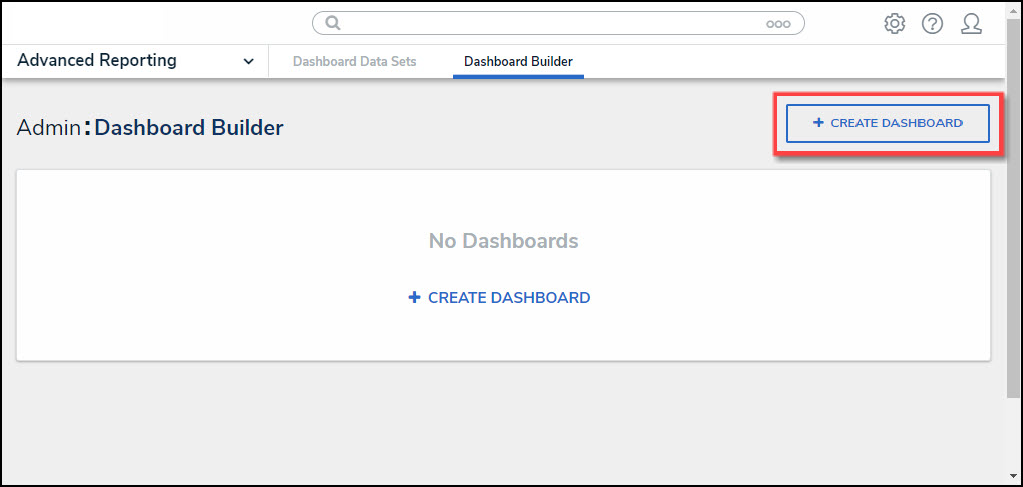
+ Create Dashboard Button
Creating a New Dashboard
- From the Create Dashboard screen, enter the Dashboard's Name in the Name field. The Dashboard Name is used to identify the Dashboard throughout the system.
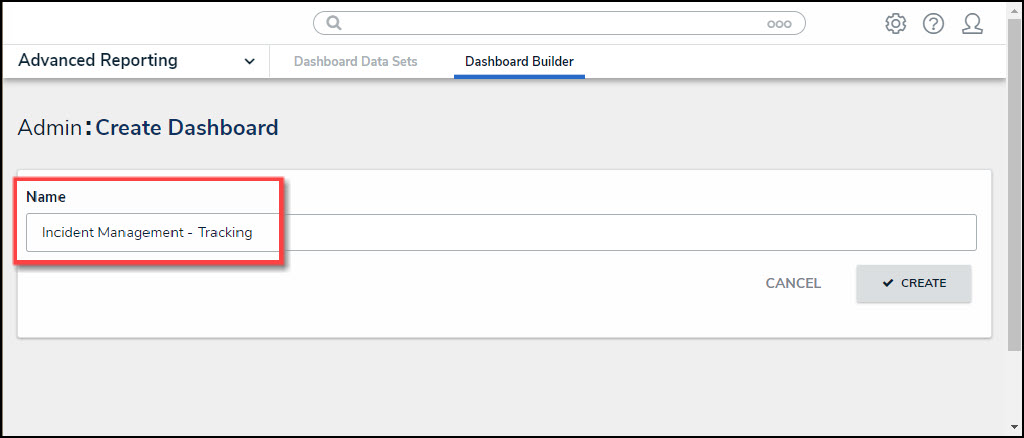
Name Field
- Click the Create button to create the Dashboard.
- The newly created Dashboard will appear on the Dashboard Builder screen.
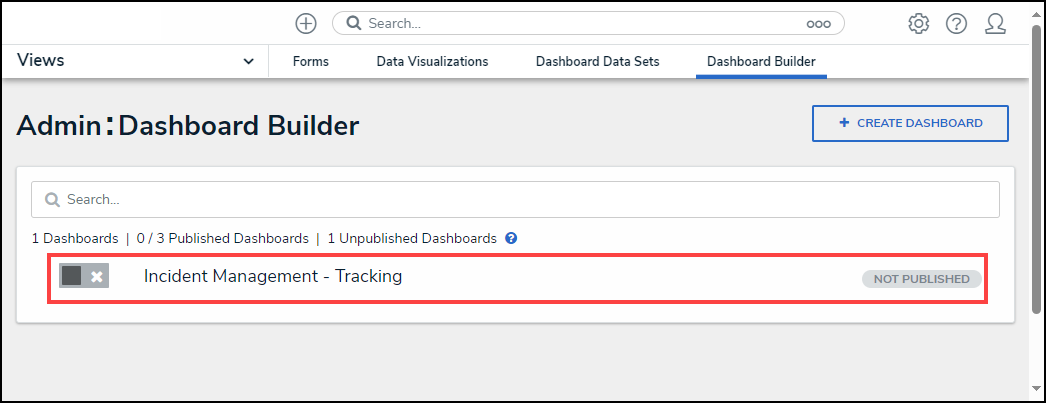
Newly Created Dashboard
- Click on the Dashboard Name.
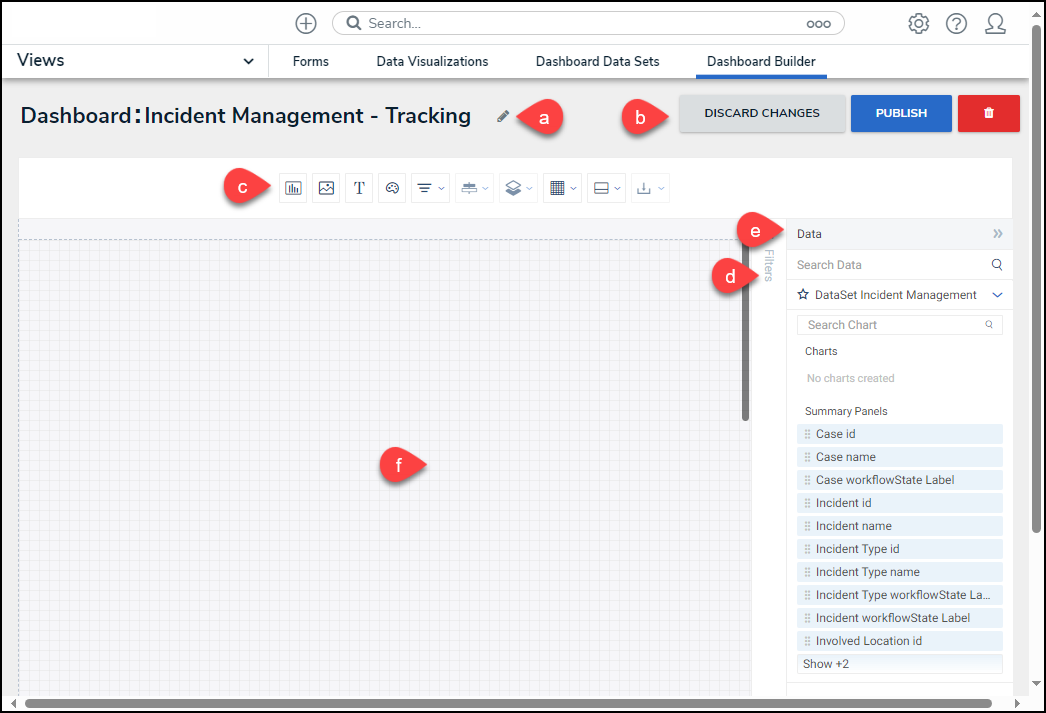
- From the Canvas Layout screen, the following elements are available to help you build your custom Dashboard:
- Edit Header: Click the Edit icon to edit the Dashboard Name.
- Action Buttons
- Discard Changes: The Discard Changes button will discard the last change and revert back to the previous save state.
- Publish: Click the Publish button to publish the Dashboard. An embedded Dashboard will show the most recently published version. Click the Publish Changes button to make revisions appear to end users. Click the Discard Changes button to discard Dashboard revisions without publishing them.
- Delete: The Delete button deletes the Dashboard.
- Toolbar:
- Create Chart: Click the Add Chart button to add a new Chart to the Dashboard Canvas.
- Image: Click the Image button and click and drag the cursor in the Canvas area to draw an Image Box. The following formats are supported for image uploads .jpeg, .png, and .gif.
- Text: Click the Text button and click and drag the cursor in the Canvas area to draw a Text Box.
- Style Themes: Click the Style Theme button to apply existing Style Themes to the Dashboard Canvas or create a new Style Theme.
- Filter Controls: Click the Filter Controls button to apply filters to the Canvas, allowing users to filter the Dashboard Data.
- Align Objects: Click the Align Objects button to align a Dashboard Object (e.g., Chart, etc.). You must select an Object before selecting an Alignment Option (e.g., Left, Center, Right) from the Align Objects dropdown menu.
- Arrange: Click the Arrange button to move a Dashboard Object to the back or front of the Canvas, allowing for Object overlap.
- Grid: Click the Grid button to enable/disable gridlines and snap to grid functions.
- Responsive View: Click the Responsive View button to choose a Dashboard View (e.g., Desktop, Tablet, Mobile).
- Download: Click the Download button to download a copy of the Dashboard. The following formats are supported for downloads .csv, PDF, and excel.
- Filters: The Filters panel lets users manage global filters defined by the Dashboard Data Set and the filters defined in your panels.
- Data: The Data panel lists all published Dashboard Data Sets and associated Objects. Charts that use data from the Data Set are connected to that Data Set.
- Canvas: The Canvas area is where the Dashboard is built. The Canvas size is 1920 px.
Canvas Overview